Dashboards and spreadsheets only tell you what is happening, not why.
Storytelling is a fundamental human skill, yet using data to tell stories is still an emerging concept.
Understanding its purpose is key to making the most of your analytics today.
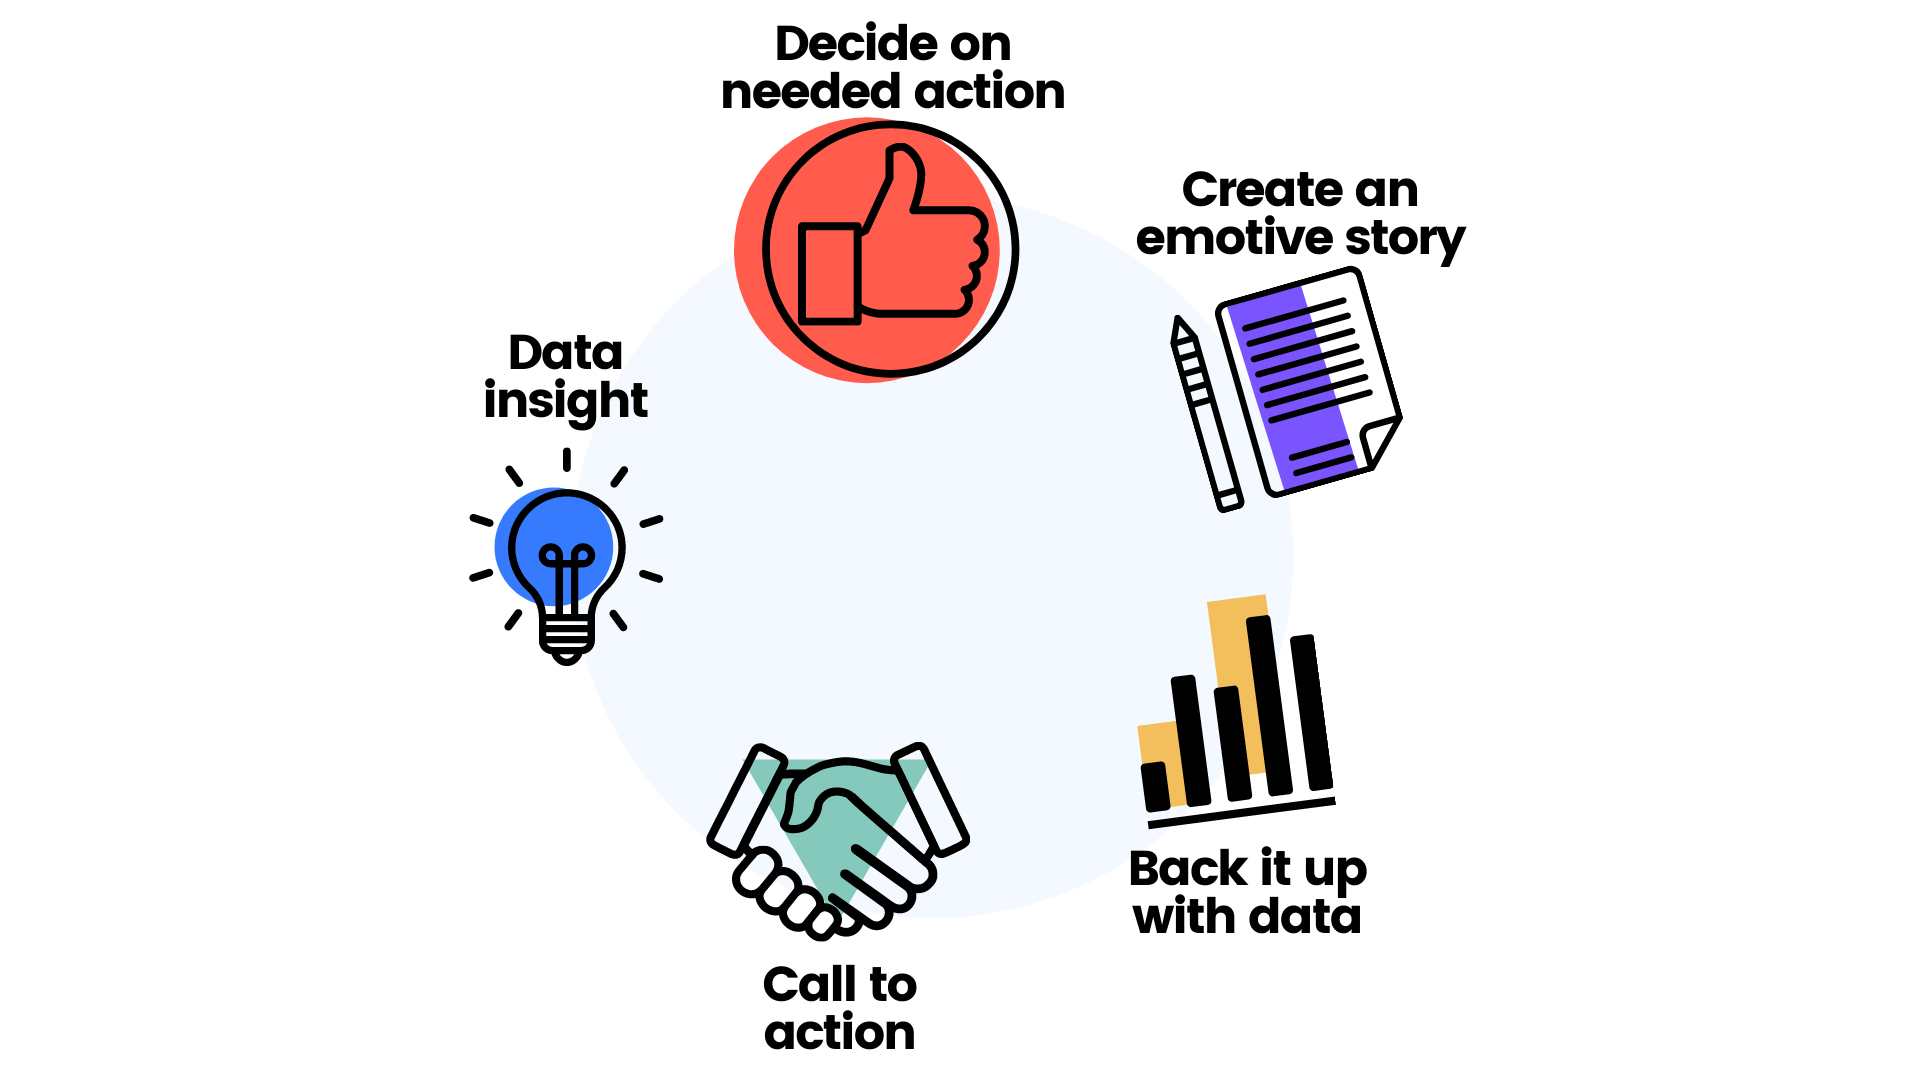
In this guide, you’ll learn how to translate data into a common language, find the sweet spot between visuals, data and narrative, and map your story to a dramatic arc. 👇

Why is data storytelling so important in analytics today?
For your business
Data storytelling not only helps users provide better context to the numbers, but can help collect information in one place so people can agree on its meaning, and align on the most appropriate action to take moving forward.
For your people
Your data storytelling will sow an idea, a memory, a feeling. People can’t forget that as easily as a standard dashboard, so they have to do something about it.

Wanna see for yourself?
Check out this guide to learn how to apply data storytelling to:
🎯 Operational reporting
🎯 Multiple projects
🎯 Employee blogging
🎯 External reporting
🎯 Internal reporting


 Follow us on LinkedIn


