The road to Damascus for PMs goes through identifying user needs. To identify if a feature introduced will fit the bill, is also one of the biggest challenges faced by PMs. Add to this, the plethora of feedback and ideas received on a daily basis; we are looking at the possibility of carpet-bombing the product with features having no real user value. To avoid such a scenario, the question that becomes imperative is...
What do we build? And more importantly, which features do we pare down?
Sometimes, what gets in a product release is at the expense of what becomes a backlog in JIRA. The answer to these questions has a high opportunity cost associated. The answer is Experimentation.
What is experimentation?
Experimentation (EXP) is an agile way to test out a hypothesis based on quantifiable metrics. It lets us measure the quantifiable impact and effectiveness of a feature. The goal with experimentation is to chaff out features that do not appeal to the users. The advantage is shortened, focused Software Development Life Cycle (SDLC) and reduction in feature failure rates.
Experimentation can be applied across the product lifecycle.
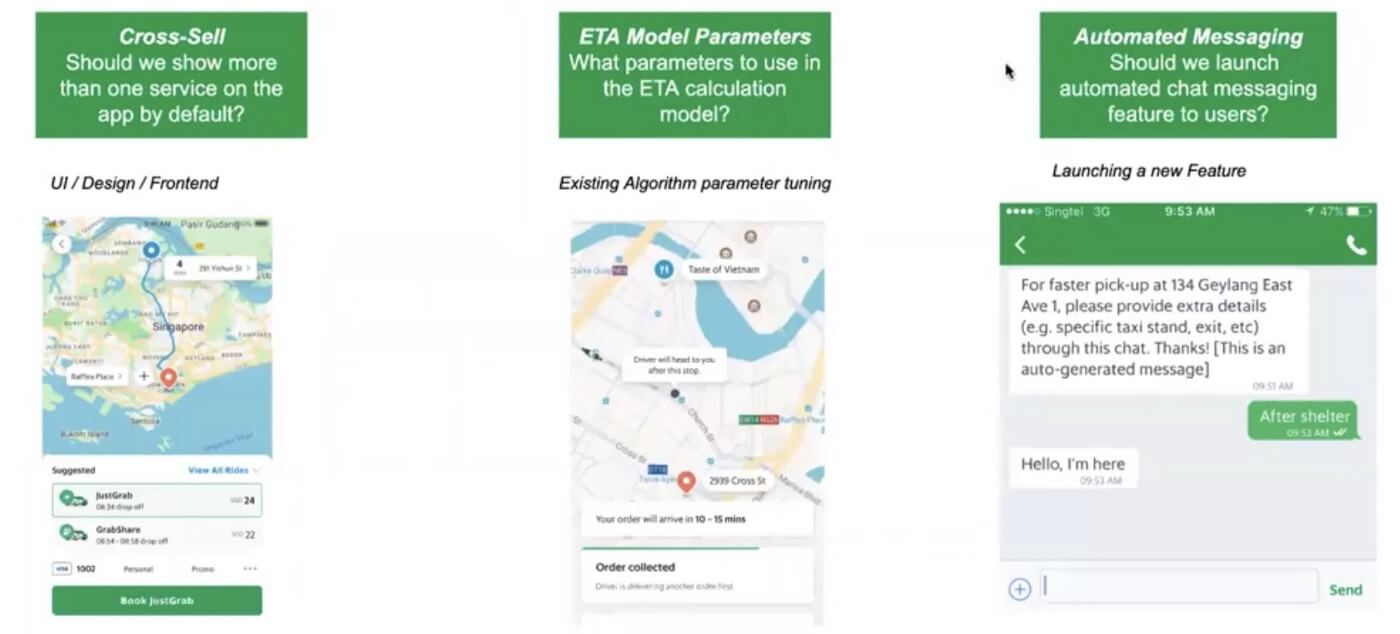
UI/ UX: What kind of map is used to showcase a rider’s journey? How many cab types do we showcase on the mobile app?
Engineering: What parameters are crucial in having a ride ETA model in place? Which parameters are primary?
New feature: What will be the overall impact of a new feature? Will the users use this feature?
Before we delve into why EXP is one of the best ways to arrive at answers to the above, there are other “not-so-great” approaches that exist too.
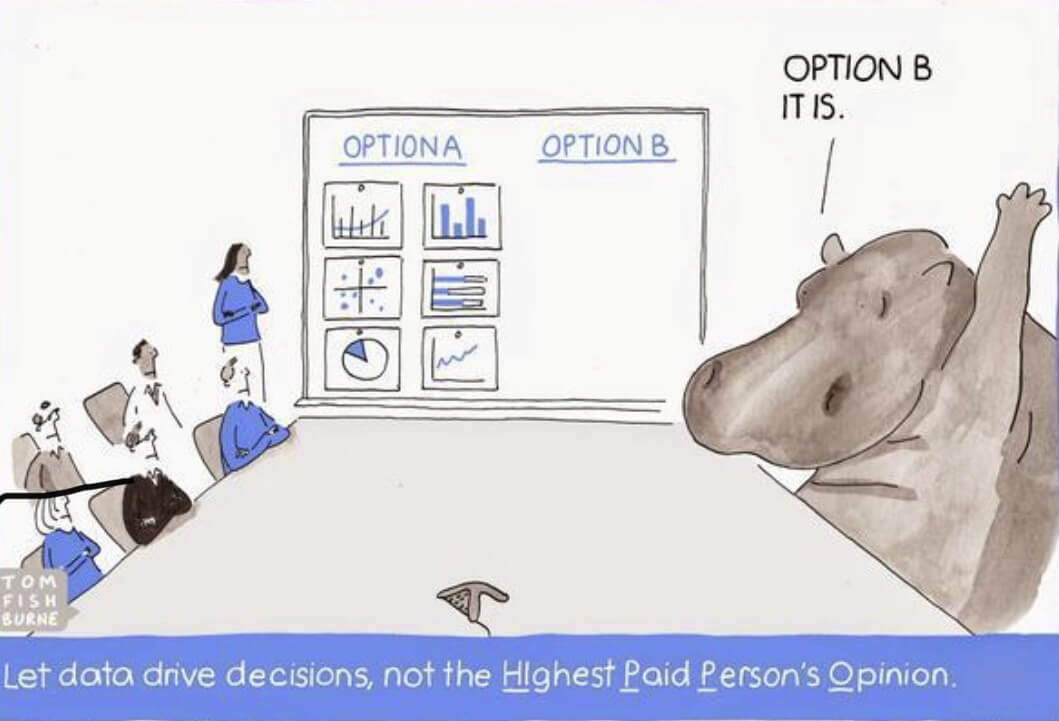
1. HIPPO
Also known as the Highest Paid Person’s Opinion. Under this, the organization relies on the decision making of the senior-most employee, especially in the absence of quantitative data. Needless to say, this approach is neither the best nor advised.
2. Hail Mary
The next approach to avoid, traditionally it is used in the dying moments of a football game. This involves throwing the long ball over a distance with the “hope” of someone catching it and scoring. It's a last-gasp effort when all fails. As exciting as it might sound, it fails more often than not and lacks strategy or planning. Product teams emulate a Hail Mary when features are launched without statistical data to back the same.

3. Launch & Report
This is the closest to doing an experiment. It can also be referred to as an early-stage EXP, where similarities such as pre-post-analysis of a feature, capturing metrics around user usage exist. The differences are in the limitations of this approach such as the absence of a time period, unavailability of a controlled environment for capturing the metrics, etc. Most organizations start their experimentation journey with this approach.
Today there are at 30 to 40 experiments active per day at Grab, which roughly translates to 300 experiments per quarter. How did Grab reach these numbers?
How did Grab start its experimentation journey?
The ride-hailing company started with A/B testing on excel sheets. While scalability was not the strongest pursuit of this approach, it also meant that experiments were time-consuming and run in silos. Another missed opportunity was of running co-relation between experiments.
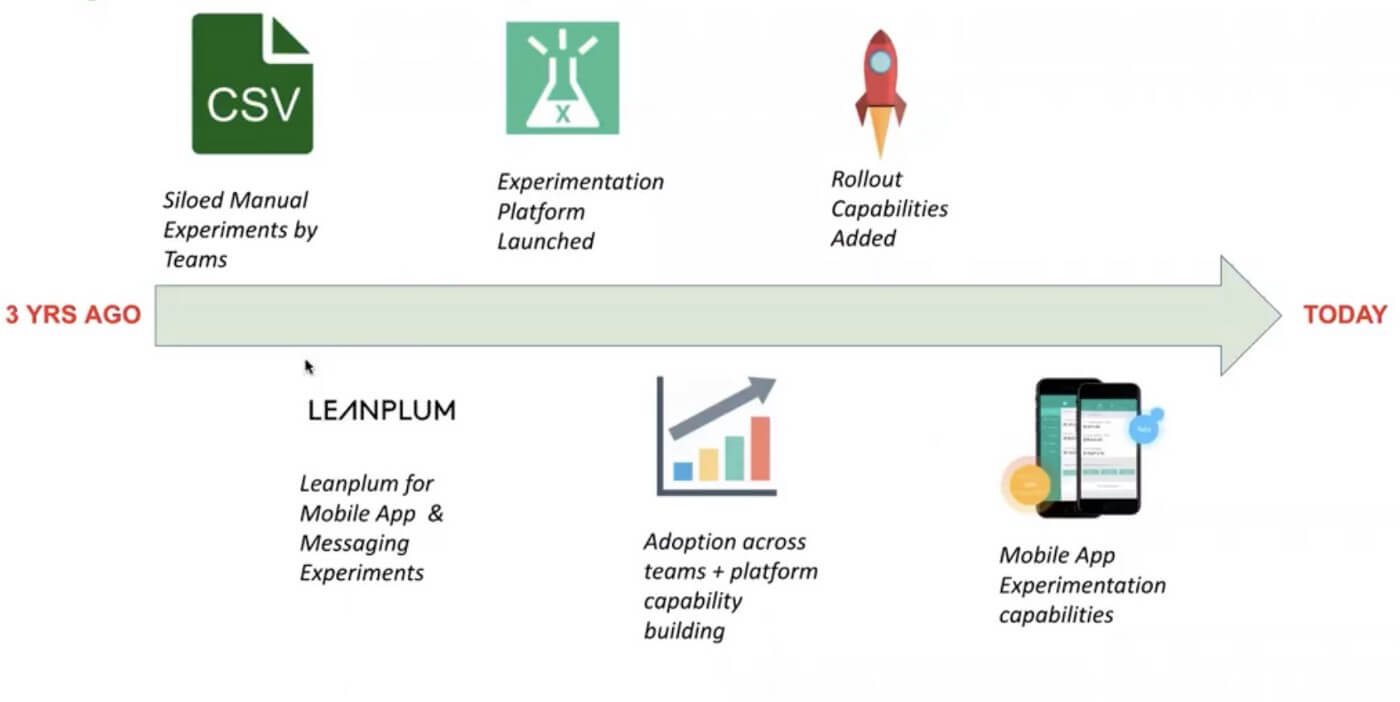
To counter this, Grab partnered with Leanplum, a San Francisco based analytics, and mobile experimentation company to experiment with front-end scenarios in relation to UI/UX. The success of this led to Grab launching its in-house unified Experimentation Platform. Let us see how the platform works.
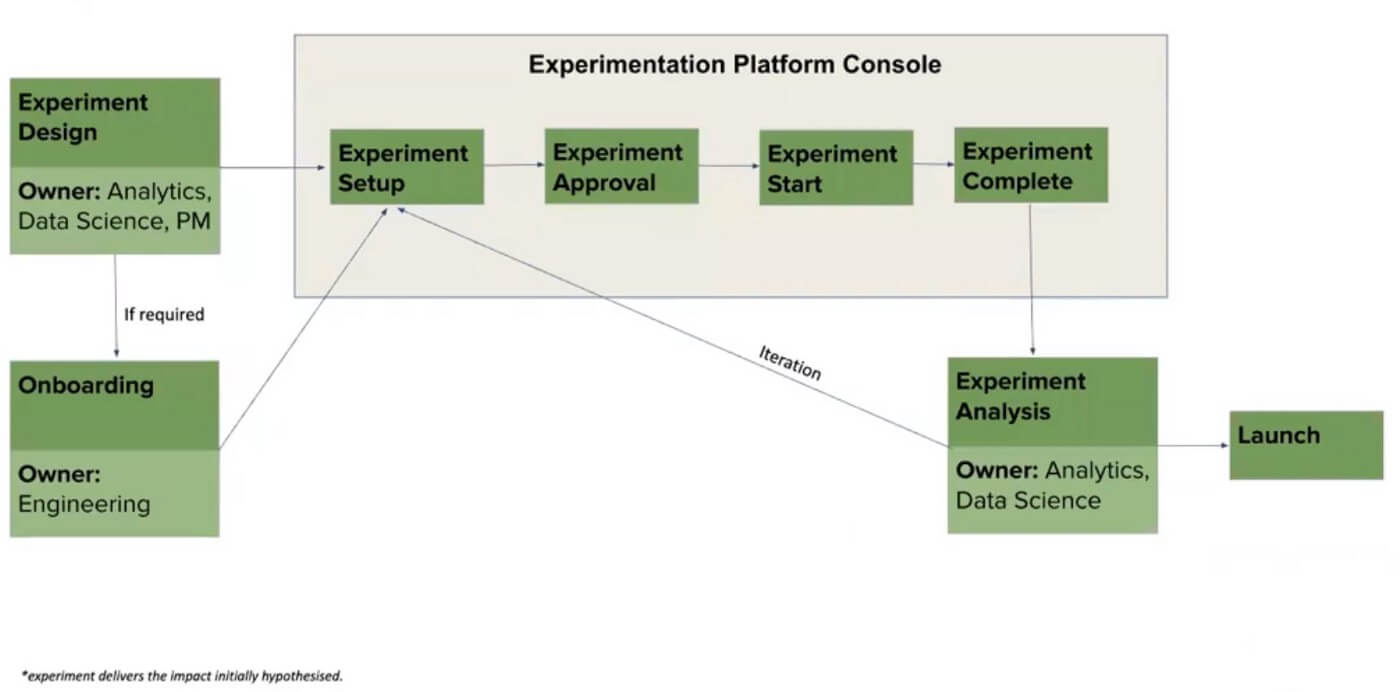
The first step is Experiment Design where the experiment hypothesis is created by a Data Scientist or a PM based on user research. An example of a hypothesis is,
While launching a feature X, we expect Y to increase by Z.
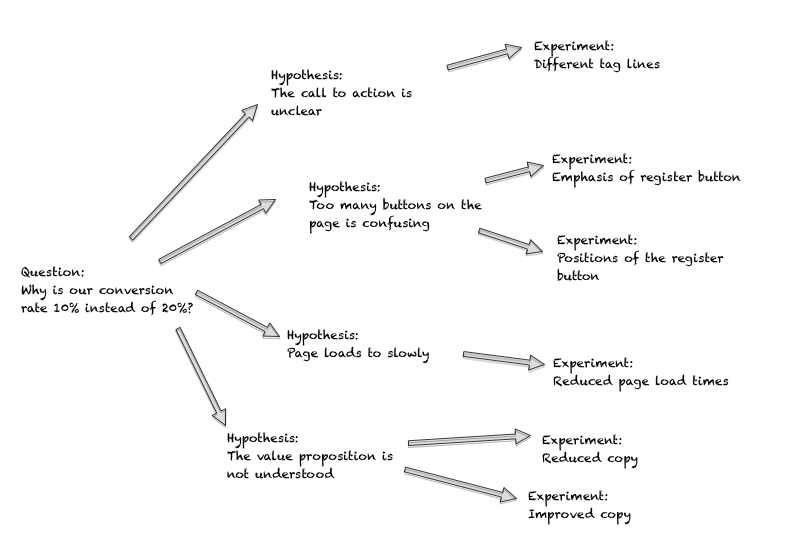
The experiment is designed around proving a hypothesis right or wrong. The Onboarding Team is roped in for their inputs in case the hypothesis is based on a new feature or functionality. Once this is done, the experience is set up on the Experimentation Platform where it first undergoes a governance approval. These approvals ensure that the right set of metrics are in place for the experiment. It is only after the sign-off is received that the experiment kick-starts with the user base. Post its completion, an analysis is run by the Analytics Team to determine whether the hypothesis is correct and then the feature is launched in lieu of the same.
Feedback loops are used to improve an existing feature and repeat the cycle of an EXP.
Let us understand the EXP process through a feature called “Automated Chat” at Grab
The problem statement
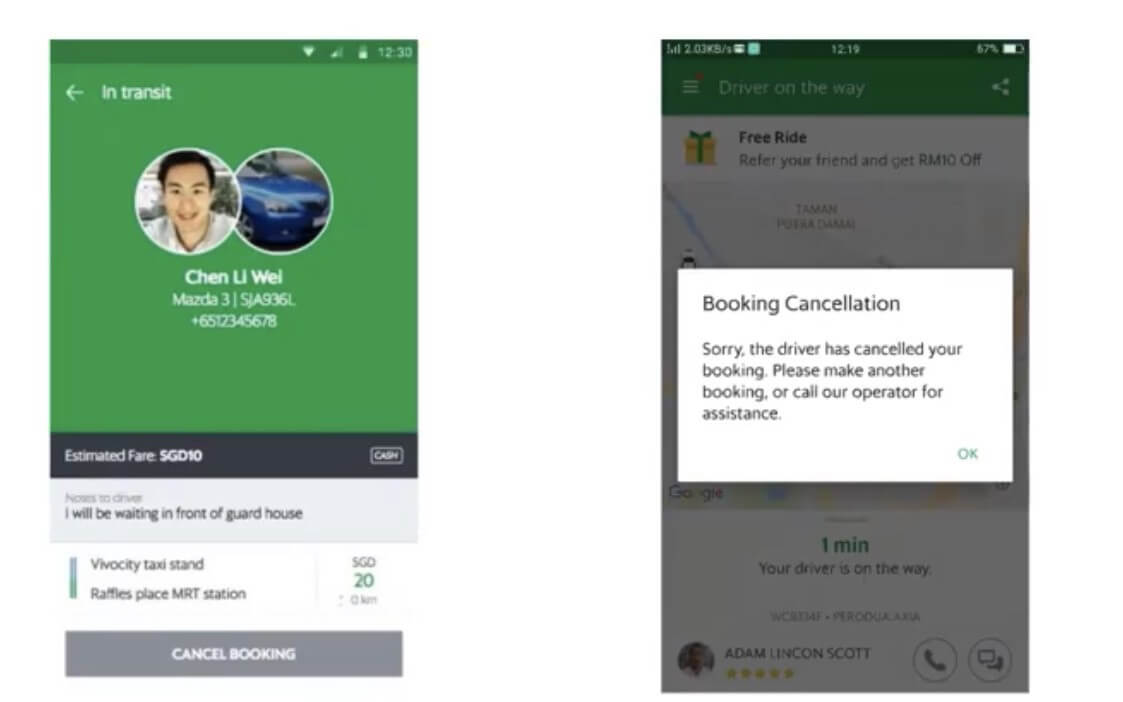
Ride cancellations leave a bad taste for the driver and the passenger. They not only erode the platform experience but also lead to cost leakage and platform churn. The team at Grab set out to incorporate a feature that could reduce or negate ride cancellations.
User Research
The first step in doing so was User Research through surveys, interviews, usability tests, etc. It revolved around answering three prominent questions.
Why do passengers cancel? Why do drivers cancel? And, What behaviors co-relate to low cancellations?
The User research results showed that the primary factor for passengers to cancel a ride was driver inactivity. For drivers, cancellations happened when they could not locate the passenger. An interesting co-relation found was, that cancellations were far less for scenarios wherein the driver and rider had established contact through a text or a call.
Experiment Hypothesis
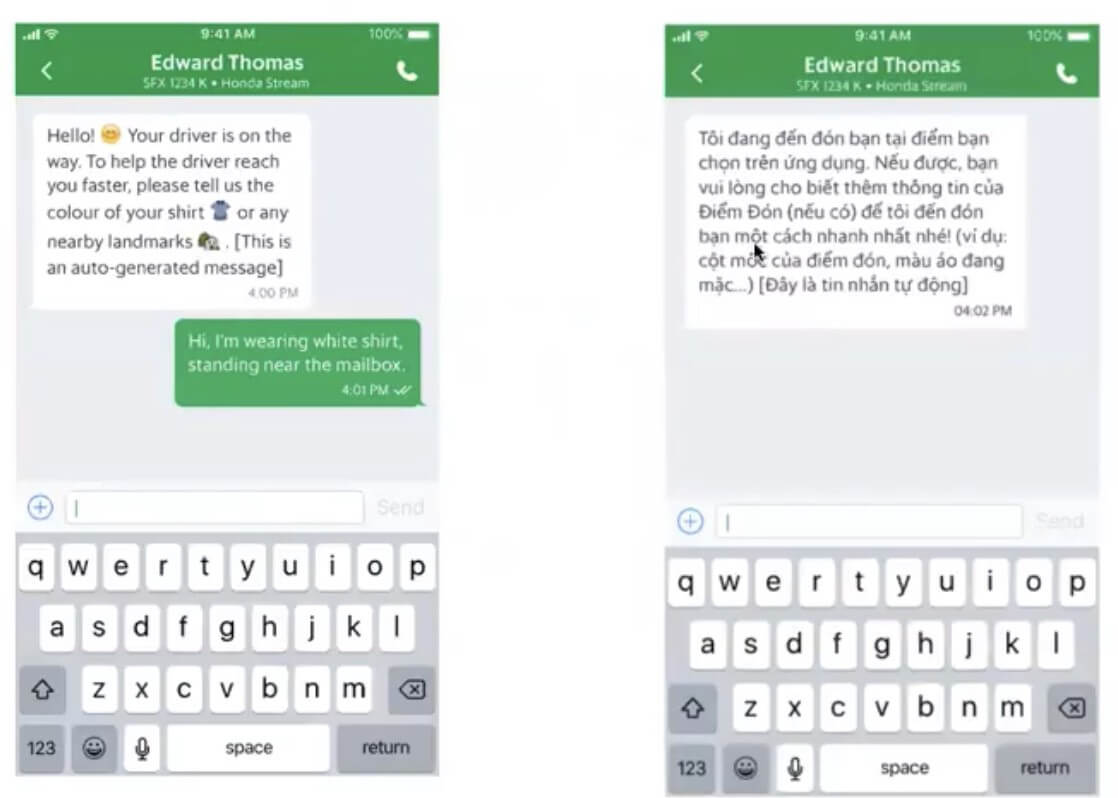
The experiment hypothesis “Automated GrabChat messaging can help reduce post-allocation cancellations by X%” was derived from user research. This meant that the post-allocation cancellations will be reduced if an automated message is sent from the driver.
Experiment Design
Based on this hypothesis, we move forward with the EXP design. It entailed factoring in parameters such as cities considered, experiment runtime, experiment unit, and the experiment strategy.
Experiment Execution & Analysis
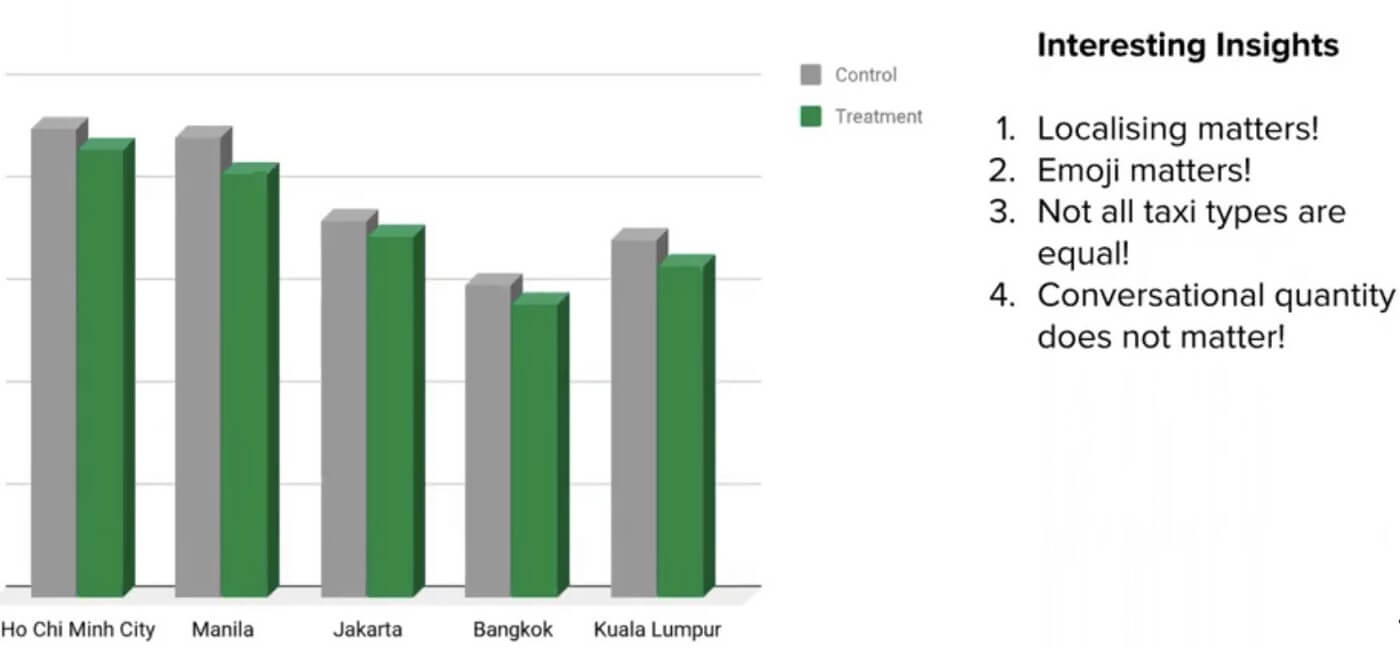
The last part of EXP involves running the experiment itself and leveraging the analytics dashboard on the platform to understand user feedback and conduct feature iterations. Some of the insights drawn on user engagement post running the Automated GrabChat experiment were:
- Localization: Communicating with passengers in their native language increased engagement.
- Emoji: Usage of emojis made the conversations personalized and human-like.
- Taxi Types: The type of taxi had minimal or no effect on user engagement levels.
- Conversation length & frequency: The length and frequency of the conversation had minimal effect on the feature.
Once a version of the Automated Grab Chat was launched, the entire process was run over a period of several months to improve it further using the Experimentation Platform. For organizations, starting their experimentation journey, the question that beckons is.
Do you build your own experimentation platform or leverage off the shelf capabilities?
The answer quite obviously depends on your needs. Sometimes off the shelf products such as Leanplum, Optimizely, VWO do not fit the bill. An example can be behind-the-scenes experiments such as Recommendation engine, Search Algorithms, etc. Another parameter apart from EXP Use cases and platform capabilities is the org maturity and scalability. The advantage with a homegrown EXP platform is its ability to connect within the enterprise ecosystem and scale further.
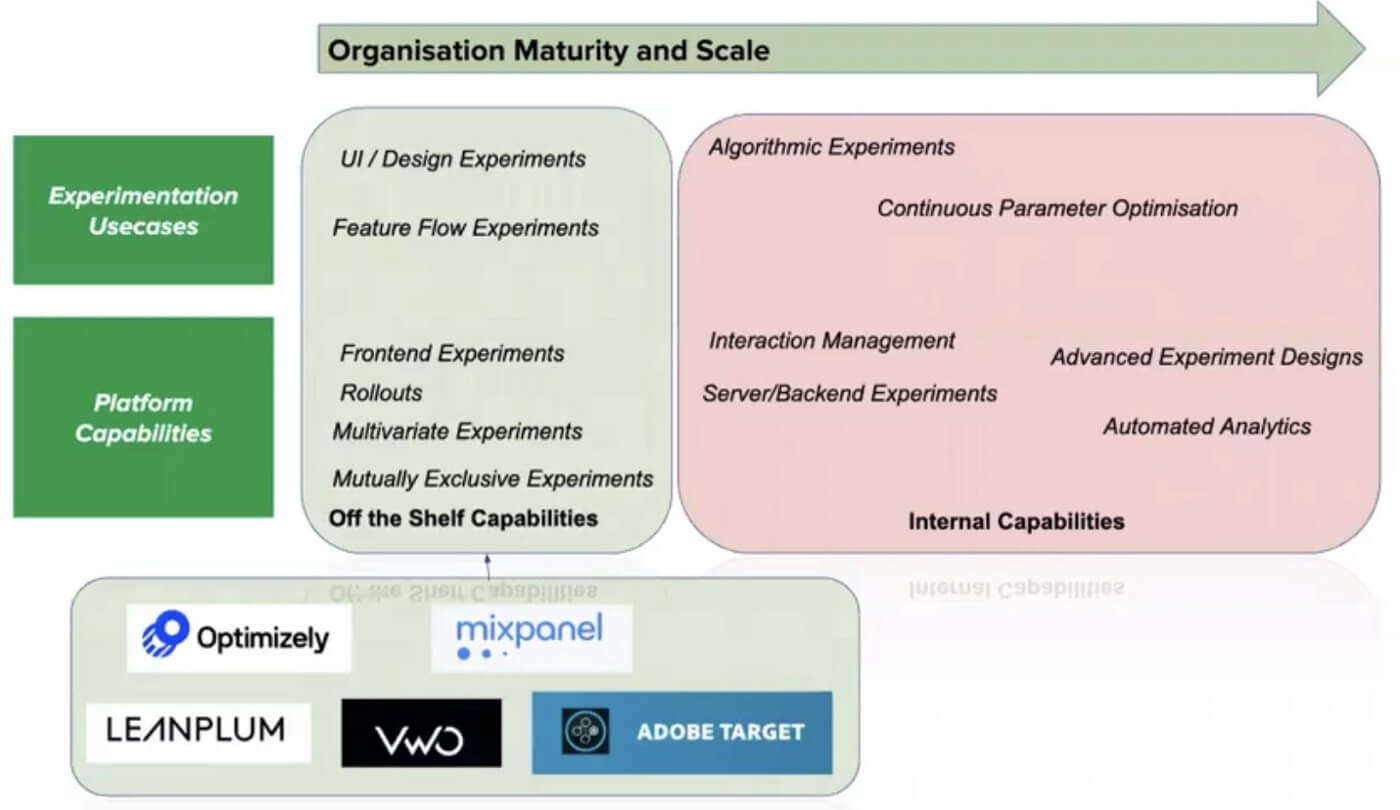
If you have decided to go on the path of creating a homegrown EXP platform. It is important to remember that an EXP is as good as its results. Here, some key points around experimentation.
1. Goal Metric
Goal Metrics are compared against the control to see if the experiment is a success or not. The properties of a good goal metric are
Measurable: The metric should be easy to measure and must have instrumentation in place. For example, if the EXP is on the search algorithm, and your feature impacts the CTR. It becomes crucial that those Clicks are measurable on the search option.
Attributable: The experiment should impact the goal metric. For example, let’s say the intention of the EXP is to make changes to an existing payment flow. Home page views would not be a great metric to start with, especially when it is not directly attributed.
Closely Coupled: Direct impact metrics are always a better choice than a high-level indirect metric. Taking the above example of EXP on the payment flow. The order conversion metric would be closely coupled to payments and is a good metric choice than a payment page conversion metric.
Low Variance: Always choose the metrics with lower variance as EXPs, in that case, can be concluded faster.
Negative Impact: Include metrics that are expected to be negatively impacted by the EXP to have a holistic picture.
Last but not the least, keep the metrics list short. Comparing too many metrics simultaneously increases the error rate.
Once we have identified the right set of metrics. The next question is, how long are the metrics run? Let us understand how low soon can we conclude an EXP for the metrics to deliver the expected results through EXP Duration.
2. EXP Duration
A great way to determine how long an EXP should be run is the Sample Size Calculator. To understand how it works. Imagine a feature A that is launched and a metric X that gets impacted by this feature. By launching A, X improves by Z%. This Z% is MDE, also known as the effect size or Minimum Detectable Effect.
It is the expected change in relative % terms to the goal metric from running the experiment. MDE is required to calculate the sample size and duration/running time of the EXP.
Experiments with a small MDE take a longer time to conclude and vice-versa. This is because being certain of small changes requires many more data points compared to being certain of larger changes.
Other factors affecting the duration of an EXP are the type of the analysis unit and size of the population/segmented experiment. Once the EXP duration is zeroed in, it must be run for the entire test duration. Early analysis can lead to incorrect results, even if the results are found to be statistically significant.
Running experiments for a lower than recommended duration will lead to underpowered experiments. Another recipe for an underpowered EXP is when the biases start creeping in.
3. EXP Biases
On average humans make 35,000 decisions every day. This decision making is more often than not is influenced by biases. Experimentation is no different. Here are some common biases during EXP.
Newness effect: Implementing a new design or feature may pique curiosity and cause users to be over-engaged.
Primacy Effect: Changing a flow or design may stump old users temporarily and the variant performance may suffer.
Carryover Effect: The effects from one variant carry over to the other variant. This can happen due to psychological/ experimental reasons or technical reasons like cached data in devices etc.
While awareness of these biases does little to eliminate it completely from an EXP. It definitely helps. Apart from biases, there are other pitfalls to avoid during the EXP journey.
4. EXP Pitfalls
The following are some of the common pitfalls to avoid to ensure high impact and experimentation success.
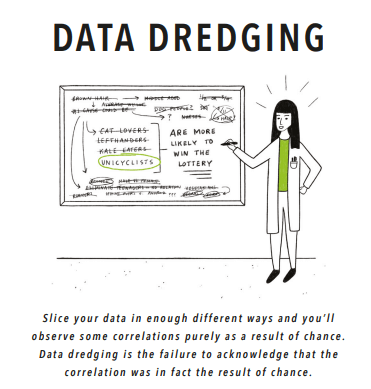
P-value Hacking: Also known as “Data Dredging”. It involves running the same experiment multiple times with minor altered parameters to achieve a p-value of <0.005.
Generalizing: An experiment that is run under specific constraints would work only for those conditions. Before concluding that functionality has led to an overall result and moving it into the product release. It is important to run sufficient iterations to demonstrate the applicability of results.
Aggregation: Even if the EXP overall did not yield a significant increase/decrease. It is possible that certain segments of the experiment have outperformed/underperformed and hence the need for segmenting results post-experimentation.
5. EXP Culture
Now that we have looked at the common fallacies and takeaways around EXP. Building a culture of experimentation is where the journey starts. The first step of this journey is understanding the resistance within the organization to EXP.
Resistance to EXP: Typical roadblocks seen are the absence of a data-driven approach within an organization and the assumption that experiments slow down the overall product cycle. While there are various ways to mitigate these concerns, the most common is to convey the bigger picture of how introducing experimentation eliminates the need for course corrections at a later stage. To build this trust, it is important that an ecosystem exists which promotes the usage of EXP. This brings us to the next point around “how to build faith?”.
Build faith: Building faith in an idea takes its own time. One of the ways to fast track experimentation is to institutionalize the whole process by having governance in place, setting up a robust platform design, running experiment hygiene best practices, and having infrastructure level checks. This helps in alignment with the key stakeholders within the org.
In a nutshell
Experimentation inculcates a growth mindset. It enables PMs to take a scientific approach towards building products that fulfill a goal. “Goal” is the keyword here. It can be a business goal or a product objective or user needs. Ideally, all of these should be intertwined but in case they do not. Remember the objective of the experiment and you are on your way to making products that users love!


 Follow us on LinkedIn


