Margaret-Ann Seger, Head of Product at Statsig, gave this presentation at the Product-Led Summit in San Francisco in 2023.
I lead the product team at a company called Statsig. Statsig is an experimentation and feature flagging platform that powers companies like Notion, Figma, Atlassian, and even Microsoft to be more data-driven in how they build products.
- Why experimentation was important at Uber
- Three arguments against experimentation
- Effect size vs. sample size
- Leveraging smart defaults
- Setting your experiment up for success
- Consider a rebrand
- Using advanced statistical techniques
- Why top-line metrics are a trap
- Using tools as an agent of change
- The importance of being pragmatic
Why experimentation was important at Uber
A lot of folks are launching products without experimenting and without being very data-driven.
I tend to learn things the hard way. One of my early experiences really hit home on why it's important to experiment. The year was 2016. I was working on our international markets at Uber, and the whole company had been working together on this big rider app redesign.
In 2016, the Uber app turned itself on its head by going destination-first. This was a big cross-company effort. There was about 12+ months of work involved and 10 big feature updates all rolled into this beautiful new app.
We launched it, we measured it as an experiment, and we started tracking the metric impact across different regions. And something interesting happened. The app was very positive in most regions, but in India and Southeast Asia, it was very bad for trips. Trips were down, revenue was down, and everything was progressing.
I was responsible for those regions at the time, and I was trying to figure out what was going on. I started to unpack all those changes, but the problem was that we’d bundled 10+ product changes into this redesign, so pinpointing exactly which one was causing these metric regressions was pretty tough.
So we started to undo them and tried to figure out which one was the culprit, and it turned out that the crux of the entire redesign was at fault.
There was previously a flow, where you entered your current location, dropped a pin, the driver would come to you, and then you’d tell them where you were going or enter it in the app optionally, but it wasn't required. We’d flipped that and said, “No, you have to enter your destination upfront. It’s mandatory.”
A bunch of great things came from this. You could provide the user an upfront price that was accurate, you could tell the driver where you were going, and so they could choose to accept or not accept based on how far they were going.
But in regions like India and Southeast Asia, it turned out that that just wasn't the culture around ride-hailing. People wanted the driver to come to them, and they’d tell the driver something like, “I'm in this neighborhood, three doors down after the church on the right.” It was all point of interest-based.
Furthermore, Google Maps locations wouldn’t snap to places that people recognized. Maps coverage just wasn't as good back in 2016.
I learned a lot from this experience, but the number one thing I learned was how important it is to be iterative and data-driven in your development. Launch one change at a time, test it, understand it, and then move on to the next because you can't just bundle these things in together and expect it to work seamlessly.
Three arguments against experimentation
When you think of world-class experimentation, you probably think of companies like Meta, Google, and Amazon, companies that have billions of users to experiment on, in-house, super-optimized platforms, plus decades of experimentation culture. The reality is that everyone's running experiments, but the problem is that only some of them have control groups and randomization.
Anytime we're launching a new feature as a PM, we're experimenting. But if you're not measuring the impact of that, you can't optimize it.
I’m going to talk about how we, as PMs, can be that voice of experimentation at a company and how we can counter a lot of the often-cited arguments that people bring up to say that they don't have the time or energy to invest in experimentation.
The arguments we’ll cover are:
- We're too small to experiment.
- We can't afford to slow down.
- We just don't have the resources.
So, let's jump in.
Effect size vs. sample size
Statistical power is the probability of detecting an effect if there actually is a true effect to detect.
The reason why this is important is because it essentially dictates how many samples you're going to need to enroll in your experiment to reach a conclusion that you can trust.
The number of samples that you enroll dictates how long you have to run an experiment for. If you're a big company, you might be able to enroll a ton of samples really quickly. But if you're a small company, it might take you significantly longer to reach that same sample size.
People often talk about sample size and say, “We're small. We just don't have the people to experiment on.” But the reality is that there's another concept at play called ‘effect size,’ which is just as important, if not more important, than sample size.
Effect size is the amount of lift you're trying to detect and how big that is. If you’re Google or Facebook, you're probably working on super-optimized flows, and you want to detect a 0.1% lift. But if you're a startup, these are brand new flows, you're new, and you need to see big impacts for it to impact your top line, so you might be going for a 20, 30, or 40% lift.
The reason this is important is because this equation that dictates power depends linearly on effect size but on the square root of sample size, which means that sample size is much less important than effect when you're looking at whether you can experiment.
The bigger the effect that you want to detect, the fewer users you have to enroll in your experiment. So, if you're a startup and you're looking for a 20% effect, you might be able to get away with relatively few users, or at least fewer than you might expect.

Let's go through a tactical example of this at work - Google versus Statsig.
Google might have 100 million users going through a given flow. Statsig is a small, Series B Company. We might have 10k users going through a flow that we're trying to test on. But we’re a startup. We need to see a big effect for this experiment to actually matter.
We're targeting a 15% effect, whereas Google is targeting maybe a 0.1% effect. So, who has a better chance of running a good experiment?
Well, if you crunch the numbers, you'll see that 10,000 times fewer users at the startup only means 100x less power, but you're targeting a 150x bigger effect. So, for NET, that means we might have 50% more statistical power. So, in this scenario, Statsig could still run experiments and expect those to be reasonable experiments that run in a reasonable amount of time.
That said, there's got to be a lower bound to this. You can't experiment on 50 people or 10 people.

Leveraging smart defaults
There’s a concept called smart defaults, which are essentially parameters for understanding how low you can go in user numbers to still experiment.
E-commerce and checkout flows are highlighted in the concept of smart defaults because those are pretty bounded and parameterized. Most online retail sites are a 2-5% conversion, and you're not going to move that a ton. It's not going to double, for example.
If you assume a 5% conversion rate on a checkout flow and you're trying to bump that by 5%, it’s a relatively small effect. Realistically, you will need high tens of thousands, if not low hundreds of thousands of users in this scenario.
And the reason is that it's a super-parameterized flow. It's not a super sensitive metric; you're only trying to detect a small effect, so you're pretty constrained in what you can do there. This shows that maybe this isn't a great flow to experiment on, and you should go further up the funnel in your experimentation.
There is a scenario for brand new startups, and Statsig was actually in this boat a couple of years ago, where you have very few users and you have no chance of running experiments.
So, what do you do in this scenario?
Beg, borrow, and steal. Take inspiration from the companies that have run experiments on similar flows. If you're an e-commerce business and you want to build a checkout flow, you can bet that companies like Amazon, Walmart, and Flipkart have super-optimized their checkout flows. If you model yours after theirs, you'll benefit secondhand from all the experiments they've run.
Setting your experiment up for success
The second argument is about time. We can't afford to slow down ship velocity.
The first thing you can do is try to shorten the total time of running your experiment. Two things you can do to optimize speed are:
- Smartly choose which part of your product you're experimenting on
- Tightly constrain the overall evaluation criteria (OEC) and ensure that you're picking a sensitive metric that has clear directionality and is something that your whole team’s going to be able to understand.
And if you do this, what you’ll probably realize is that we were focusing at the bottom of the funnel and trying to optimize checkout events, but what we could’ve done is moved further up the funnel and gone to a part like product view or product details, where we’d be getting more samples, and we'd be able to run a tighter experiment faster.

Consider a rebrand
The other thing you can do is rebrand how you frame experimentation within your org. People think of experimentation as quantifying the upside, but it's as much about that as it is about catching regressions and mitigating against the downside.
For example, we had a beer delivery service that was a customer of ours, and they ran an interesting experiment where they wanted to optimize signup flow by adding a Google Maps address autocomplete component.
They figured that they were going to measure signup flow increase, but what actually happened was that app session rates skyrocketed, and they couldn't figure out why.
It turned out that people were actually killing the app and restarting their session with this new version. So they started to slice and dice the data, and they realized it was disproportionately on small phone screens.
As they dug into it, they realized this new Google address autocomplete component wasn't scrolling properly on small devices. Only the first and second addresses showed up, and if your address wasn't one of those, you were basically trying to get to something that didn't exist. So, people were killing the app and restarting it.
So, by measuring all these ancillary, guardrail, secondary metrics, they were able to catch a regression much faster than if they'd just been waiting to see an increase in signups.
Oftentimes, you can get to a regression outcome much faster because metric regressions typically happen because of a bug or bad UX, and they usually have a much larger effect. And the bigger the effect, the fewer samples you need, and the faster you're going to see it.
So there’s this interesting asymmetric upside downside between trying to capture lift versus mitigating against the downside.
Using advanced statistical techniques
Another thing you can do is use some powerful statistical techniques that help you run faster experiments.
The first one is called CUPED, which stands for controlled experiments using pre-experiment data. CUPED looks at any pre-exposure bias or variance in the test control groups and helps prevent that so you can essentially shrink your confidence intervals and run faster experiments.
Let's go through a tactical example.
Let’s say we're testing universal basic income. We're going to give every American $2,000 a week and see what that does to their spending power.
In this world, we divide up our American populations into two random groups, but oops, we put both Bill Gates and Jeff Bezos in the control group.
If you were to run this experiment, you’d basically see no difference in the spending power between these two groups. In reality, what's going on behind the scenes is you did have a massive impact on the spending power of the test group that you gave money to. Still, you can't detect that because it's so far outweighed by the spending power that existed pre-experiment of the control group.
CUPED helps to reduce this variance and remove these outliers so you can get tighter, accurate results faster.

We've all been guilty of peeking at an experiment before it was finished running, and this is called the ‘peeking problem.’ It's the bane of data scientists everywhere. The risk is that you look at an experiment early before the data has fully baked, and you walk away with the wrong conclusion.
What's cool is there's this thing called sequential testing that helps prevent this by dynamically adjusting the confidence intervals based on how far into the experiment you are. It'll raise the bar on making a decision and seeing a statistically significant result earlier in the experiment relative to later.
Why top-line metrics are a trap
We've all been in that situation where a VP comes to us and says, “It's the end of the quarter. We have to hit this KPI. Can we just rush this out the door? We don't have time to split it 50/50. If there's a big impact, won’t we see in the top-line numbers?”
I’ve been through this before and have acquiesced earlier in my career.
A good example was Uber. It was the end of the quarter, and we were trying to Iaunch a set of new payment methods in India to optimize signup conversion. We didn't launch them as a test because we were trying to juice the numbers before the end of the quarter, and suddenly, our trips charts skyrocketed.
We patted ourselves on the back and went home for the weekend. We came back on Monday, and our ops team in Bangalore said, “That wasn't because of the payment method. That was Diwali. Everyone's going home to family.” Everyone was traveling, and trips would’ve skyrocketed no matter what we did.
I think this is a good lesson in how dashboards are just inferior causality measurement tools. Ecosystem effects are complex, whether it's seasonality or it's a change that increases a metric but then regresses another parallel metric so you see no top-line change. There's a lot going on under the covers in top-line numbers, and you can't read anything into that.
Using tools as an agent of change
Last but not least, resources. As PMs, we’re very well-versed in the resourcing conversation. We don't have the time, people, or energy to spin up a culture of experimentation. How do you counter that?
Well, one thing we come back to frequently at Statsig is tooling. We have this famous quote that we put on posters and walls, and we talk to customers about it:
“We shape our tools, and thereafter, our tools shape us.”
I think this is really true because if you have a good experimentation stack, it can help supercharge your practice, but if you have bad tooling, it'll get in your way. It'll drag you down, it'll give you inaccurate results, it'll confuse people, and it'll add more overhead than it’ll help alleviate.
So, what does a good experimentation tool do?
One, it scales your data science team. A lot of times, when you suggest running more experiments, data scientists will immediately think about the linear effect that’ll have on how much work they have to do. And a lot of that is repeat analysis. It's the things that you can get out of the box in a good tool.
The other thing it'll do is create the right hooks to bring people into the experimentation process at the right times. It'll tell you when your experiment has hit target durations so that people aren't constantly trying to check whether it's done. It’ll help alert you if something in the setup of the experiment is incorrect and you have bias early on, so you can reset and not waste two weeks.
Lastly, a good experimentation tool will democratize access to experimentation. Instead of one or two individuals feeling like they have to shoulder the load of building a culture of experimentation, everyone will be involved, whether it's PMs, data scientists, or engineers.
At first, this makes some data scientists feel uncomfortable. They think PMs don't understand experimentation, and the engineers will set it up incorrectly. But with the right tools and culture, you can scale that in a way that doesn't ever rely on one or two individuals shouldering the load. Many hands make light work.
The importance of being pragmatic
When resources are the issue, you have to be really pragmatic in the argument you make.
As PMs, we often get dragged into quarterly prioritization, and people say, “I need to fund this initiative for a 5% growth win,” or, “I want to put resources against this for a 10% revenue bump.” But no one talks about the things you lose by not measuring impact.
In our experience and from a bunch of industry-wide data, roughly a third of the features you ship work and work out of the box.
30% has the desired impact. 30% requires iteration, and maybe it's metrics-neutral. 30% of your features are actively bad and should be turned off. And if you think about each third, what does that do to your top-line metric?

Well, if this is what you're seeing on a dashboard, what's actually going on under the covers is a bunch of metric regressions that you may not even realize are happening because you're not quantifying the impact of that feature.
What if you measured the impact of every feature and didn't ship the bad ones or the losers? That would fundamentally shift your top-line metric in a way that a resourcing conversation here and a new team there couldn't ever hope to do.
And what's cool about experimentation is if you scale this across your whole organization, it's not limited to the one metric you experiment on. This’ll start to permeate every single metric, and you'll be fundamentally shifting the curve.
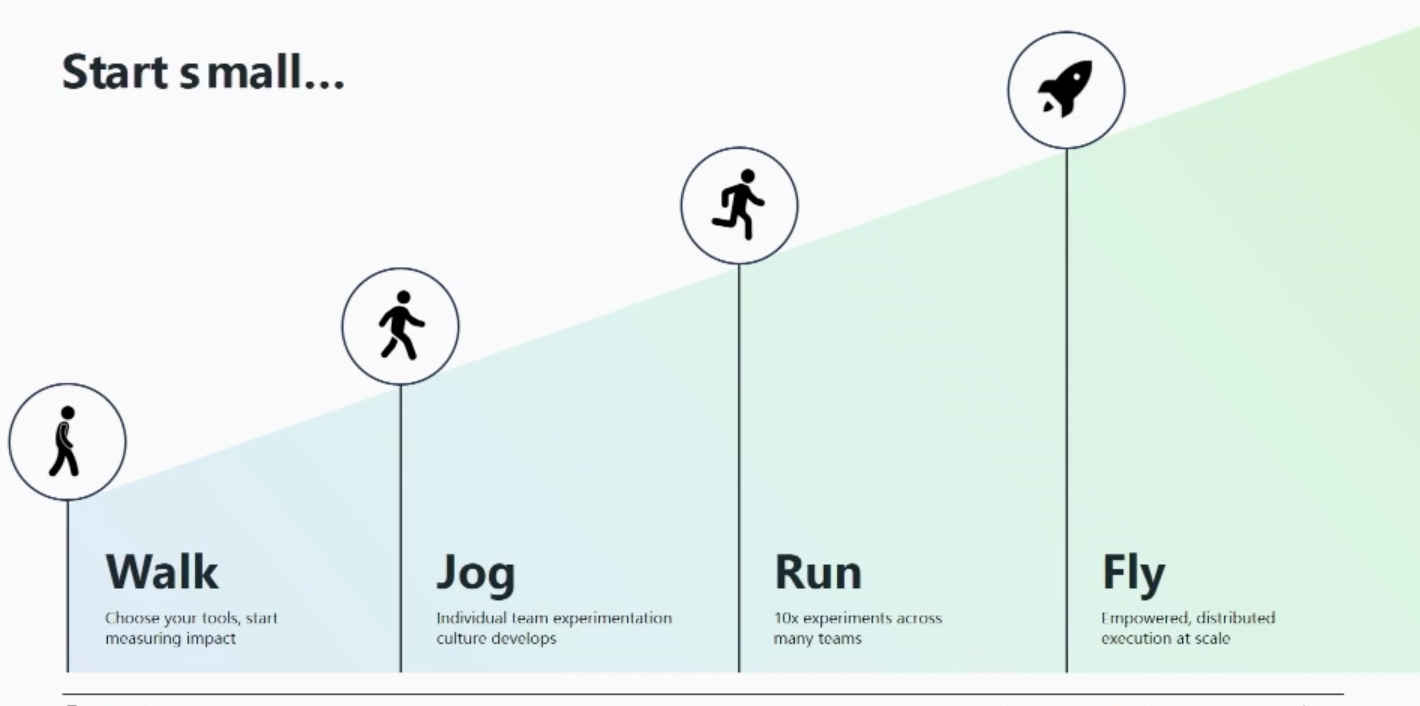
It's very intimidating when you think about the amount of resources you have to put towards spinning up a culture of experimentation. But we tell a lot of customers that they don't have to go straight from zero to Meta and Google-level experimentation. You can walk, jog, run, and then fly.
Conclusion
In summary, if you hear the argument that, “We're too small, we just don't have the users to experiment,” counter that with the power of effect size versus sample size, which a lot of people won't have thought about deeply. And then think about your company in terms of smart defaults. How do you fit in relative to that framework?
And if all else fails and you really are super small and just getting going, think about creative workarounds. Can you take inspiration from those companies that have already optimized these flows?
If you hear, “We can't slow down, we can't afford to spend the time,” counter that with all the ways you can set your experiments up to run in less time, whether that's choosing a more up funnel metric, or using advanced statistical techniques like CUPED or sequential testing.
Then, rebrand how you talk about experimentation. Start with, “Let's capture regressions, let's protect against downside,” instead of, “Let's try to quantify lift.”
If it's a resourcing issue, tooling can be huge. Think deeply about the tools you use. There are a lot of good tools on the market.
Be pragmatic. Cite the rule of thirds. Say, “Hey, we're probably shipping a bunch of bad features right now. We don't even know.” Think about the impact that would have.
Last but not least, start small. You can walk before you run before you fly.


Product-led alliance insider
Thank you for subscribing
Level up your product-led alliance career & network with product-led alliance experts.
An email has been successfully sent to confirm your subscription.
 Follow us on LinkedIn