In this article, I explore how we zero-in and focus on our goals in product. I'll discuss creating a growth model to help understand how your metrics span across different growth channels, and use that as a language to communicate with other stakeholders, as well as in executive meetings.
Then I'll get into how we execute and understand the things we should be doing in our growth strategies, and what we shouldn't be doing. I'll introduce a scoring framework.
Then using that to answer the question - how do we maximize our efficiency and effectiveness on executing towards that goal?
Why measurements and frameworks matter
First, I want to show you this graph.
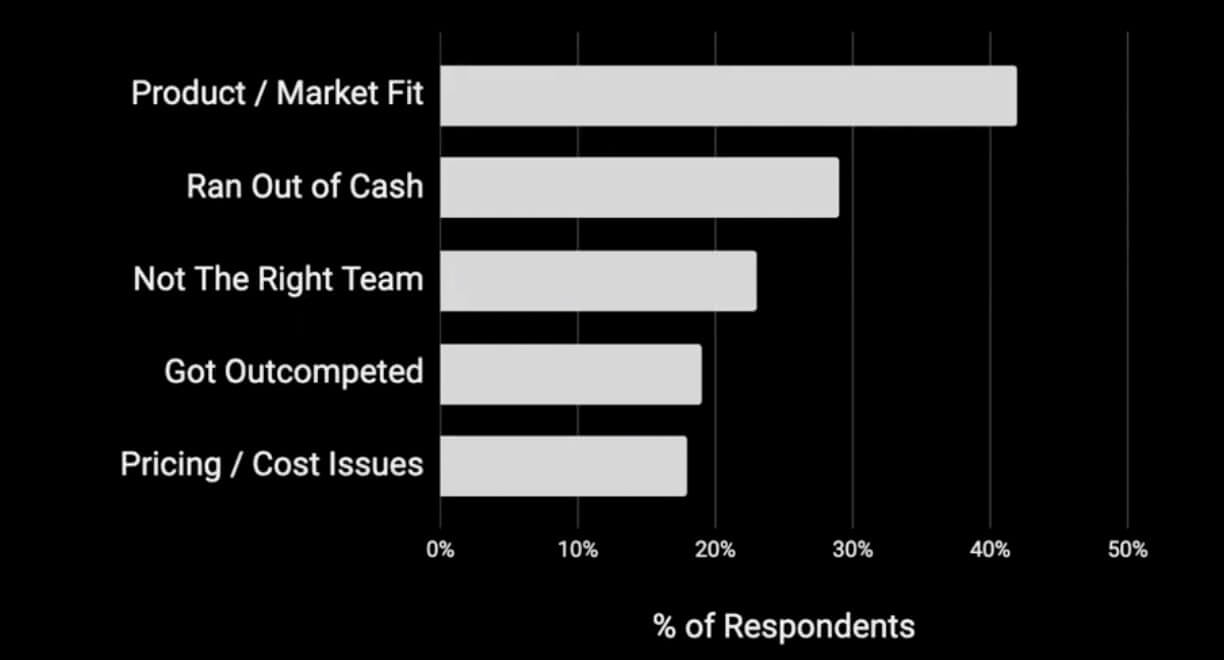
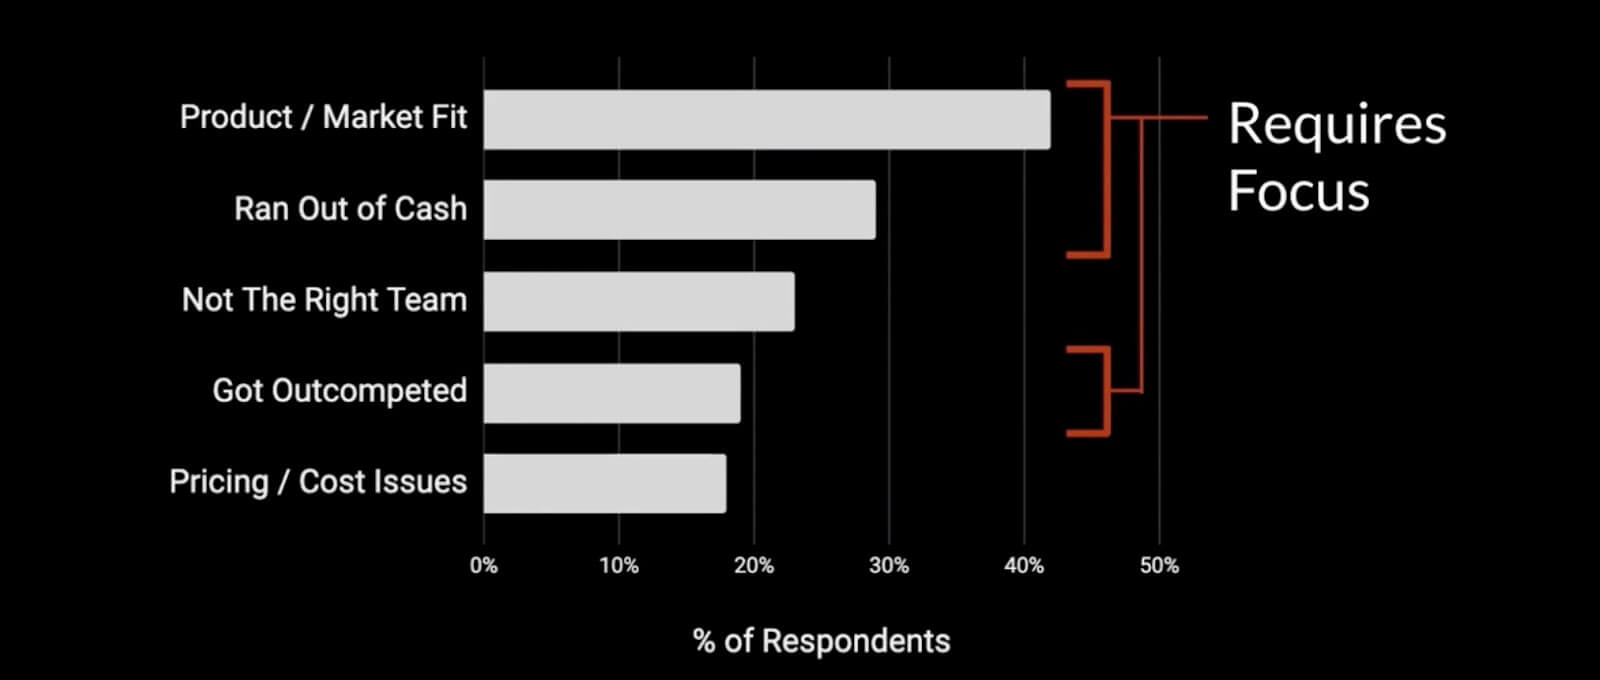
These are actually the top five reasons why startups or new products fail. The reason I included it and think it's really interesting is that I would say three out of these five reasons are actually avoidable, with focus.
The antidote
I say, if we can employ some of these processes and strategies, and the reason why they're so important, is because if you're focused on understanding how to develop the product in a way that helps you grow, you can obviously raise more funding, in this case, you can out-compete your competitors.
So you really do have to have a strong framework and when you think about growth it's really a process. When we're interviewing candidates for growth roles, we really dig into:
- What is their process?
- How strong is it?
- How sophisticated is it? And,
- How diligent are they with executing it?
The Goal
Some of you reading may be familiar with this book called The Goal, it's actually a required read for Amazon execs.
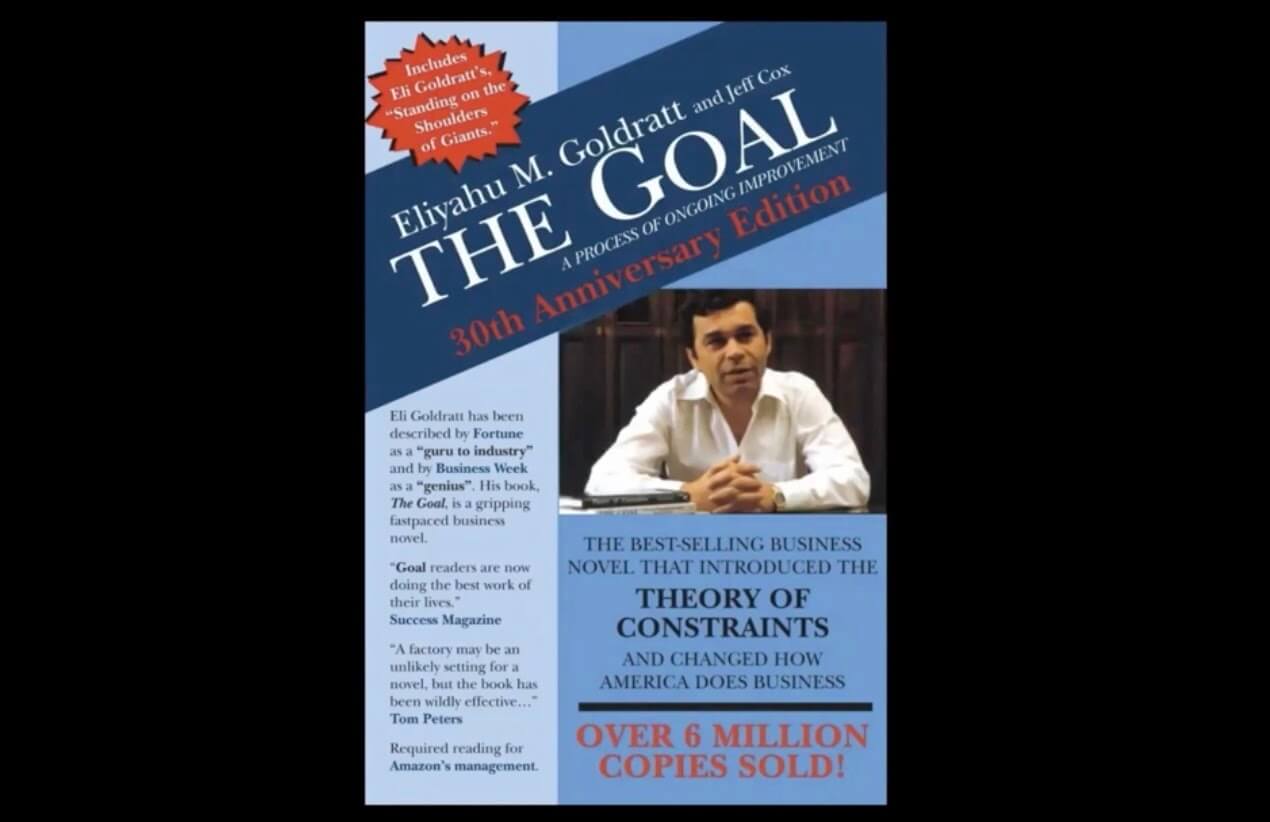
The reason why I like it is it talks about this theory of constraints and about looking at the system as a whole. It basically argues that the goal of any company is to make money, the problem is, it isn't always ingrained in people's OKRs, goals, or whatever it may be.
We haven't really created this structure across our different departments or even within a department to say all the things we're doing, how did they ladder up to this goal of making money?
That's what I want to go through, present some strategies and some ways to think about how we can tie everything back and make sure you're maximizing your impact on that goal.
That leads me into how to create a growth model...
Creating a growth model
If you're not familiar with a growth model, a growth model is like a financial model that's more centered and structured around the metrics you can affect.
So rather than being more output metrics, like how many people we're acquiring, it's things like:
- What's our conversion rate?
- What is the cost per click on our ads?
- What's our referral rate?
These are metrics we think we can affect.
But first, what are different growth levers we should be thinking about?
How to prioritize across growth levers?
Here are some of the main growth levers that come up most frequently.
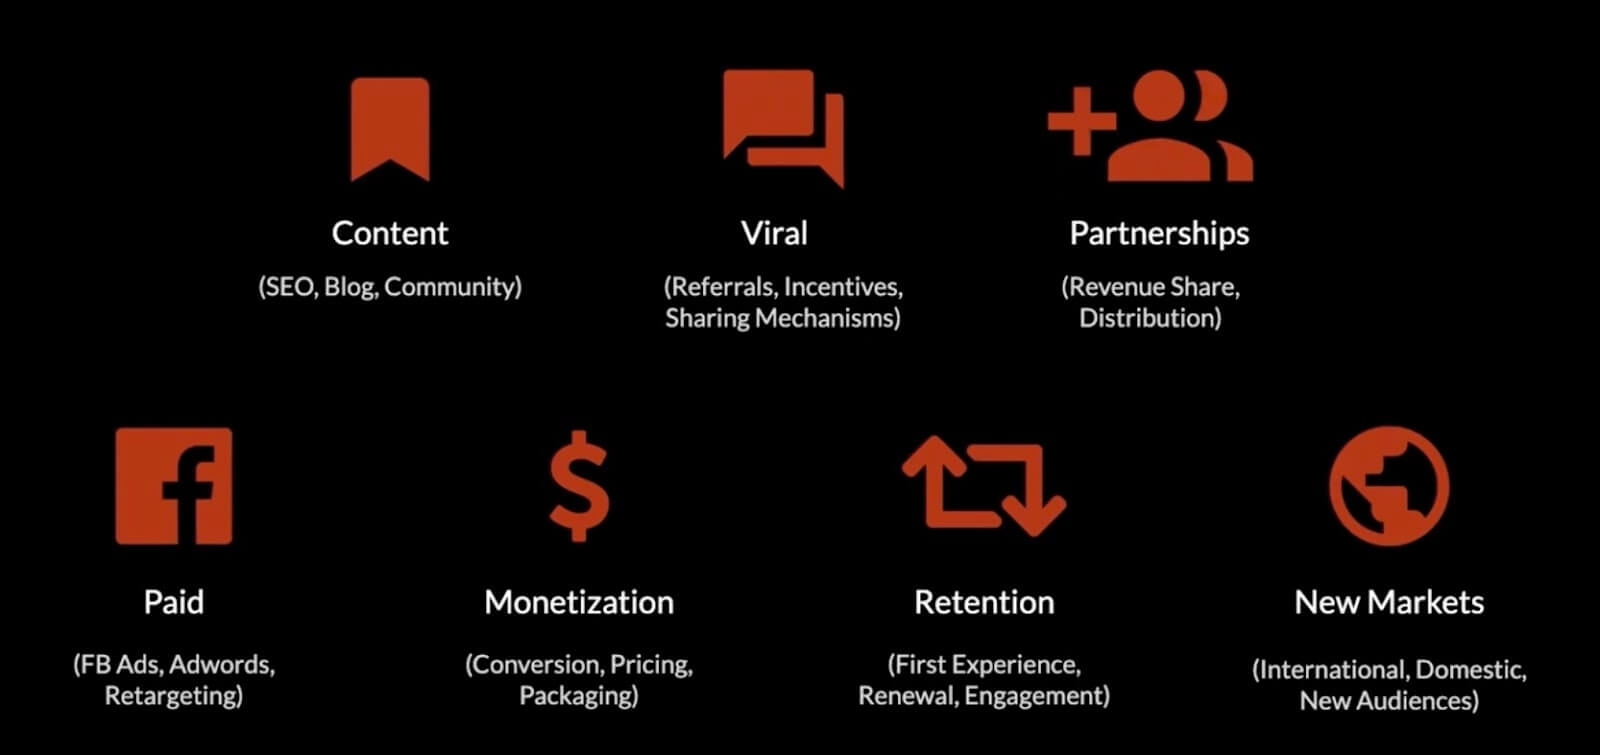
This is different for all different businesses, for some businesses these are important, for some they're not. It's different for B2B, these are mostly consumer side but some branch over to B2B as well.
The point is there's a lot of different things, there's a lot of growth levers, there's a lot of things you can do. The question is, how do we prioritize across these growth levers?
That's what a growth model helps us do.
Common growth model metrics
Here are some of the common growth model metrics.
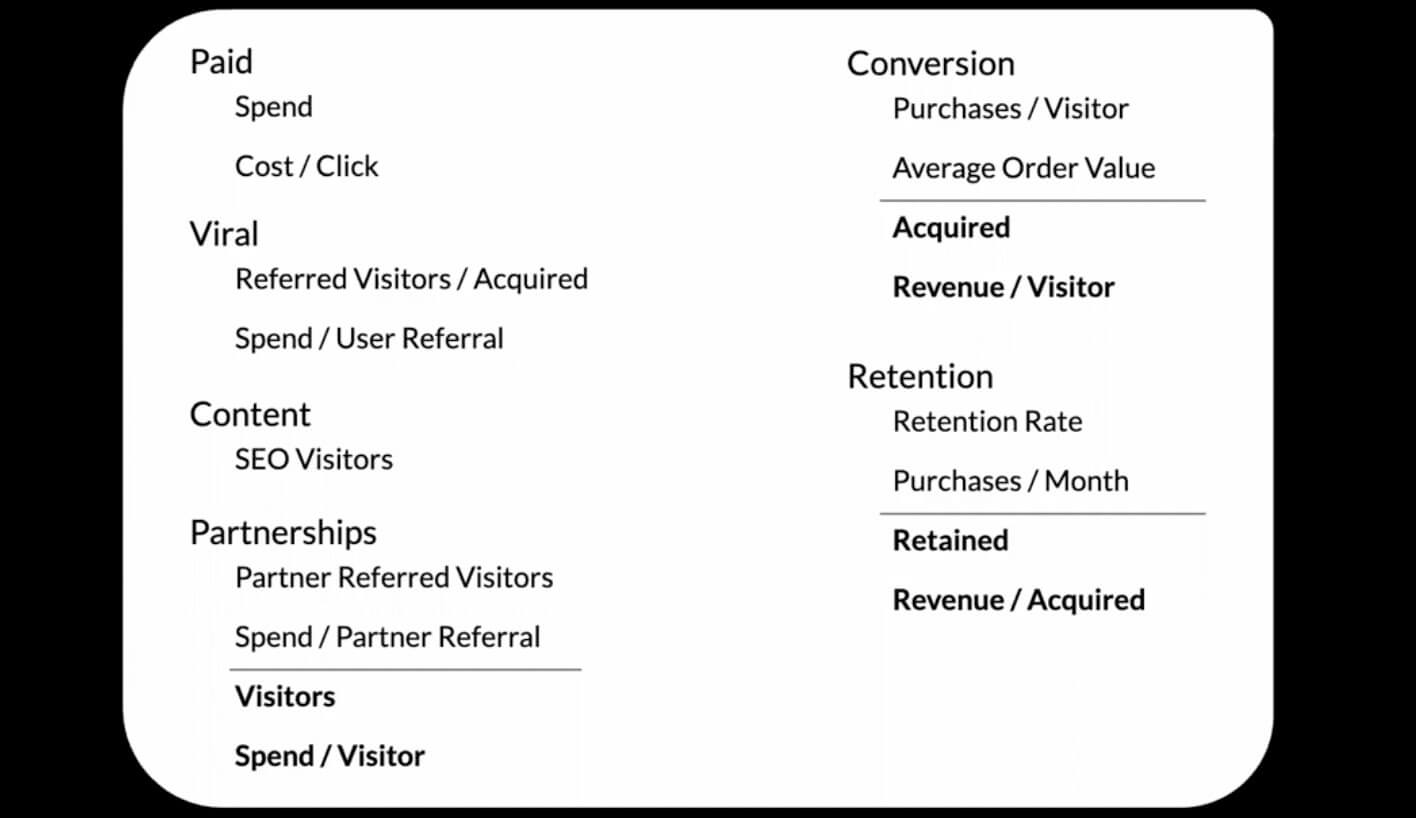
This is just an example and again, as I mentioned, it can change according to your business. But when you look through this, you'll see we have two core metrics per growth lever and I'll dive into this a bit more.
Volume & conversion metrics
One of them is a volume metric, things like spend or SEO visitors, things like that, and then one of them is a conversion metrics.
You have the volume come in, and then you have the conversion and that's what you get out. In this case, what we get out is spend per visitor or acquired revenue per visitor.
CAC or LTV
What you'll notice looking at this across your business, the whole thing is CAC or LTV.
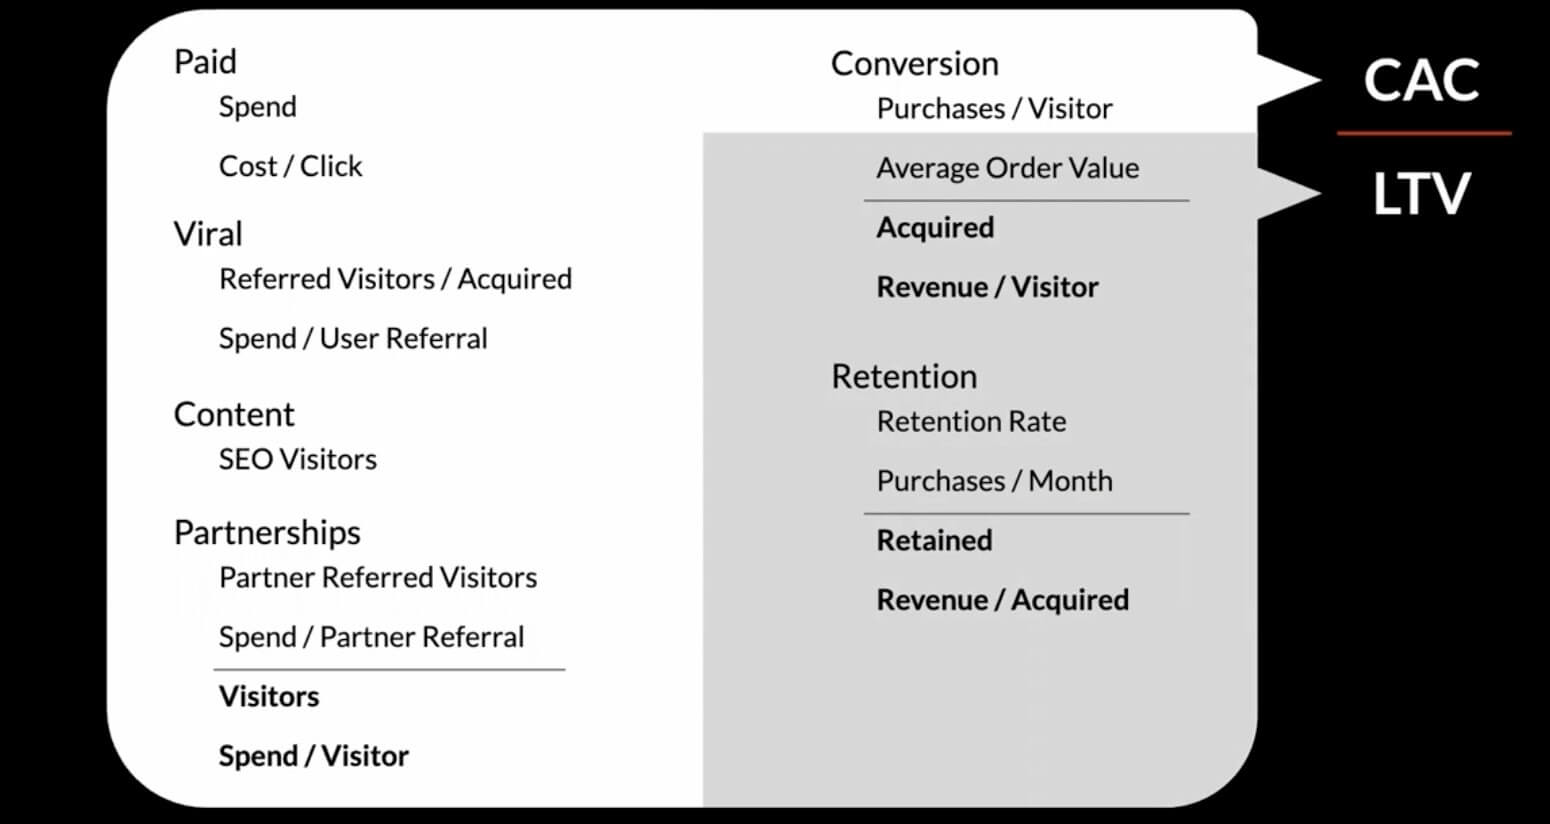
We tend to think about CAC over LTV or LTV over CAC ratio as being just contained within marketing and acquisition. But it really spans across the entire product.
We really do have all these metrics that are interrelated and are interconnected. Yet, most businesses and most companies don't spend the time to understand how these different metrics are related.
You need to be able to understand, if you had a 10% decrease in cost per click, how does that then translate to impact CAC over LTV? So you can make those decisions and those trade-offs, and then have that conversation.
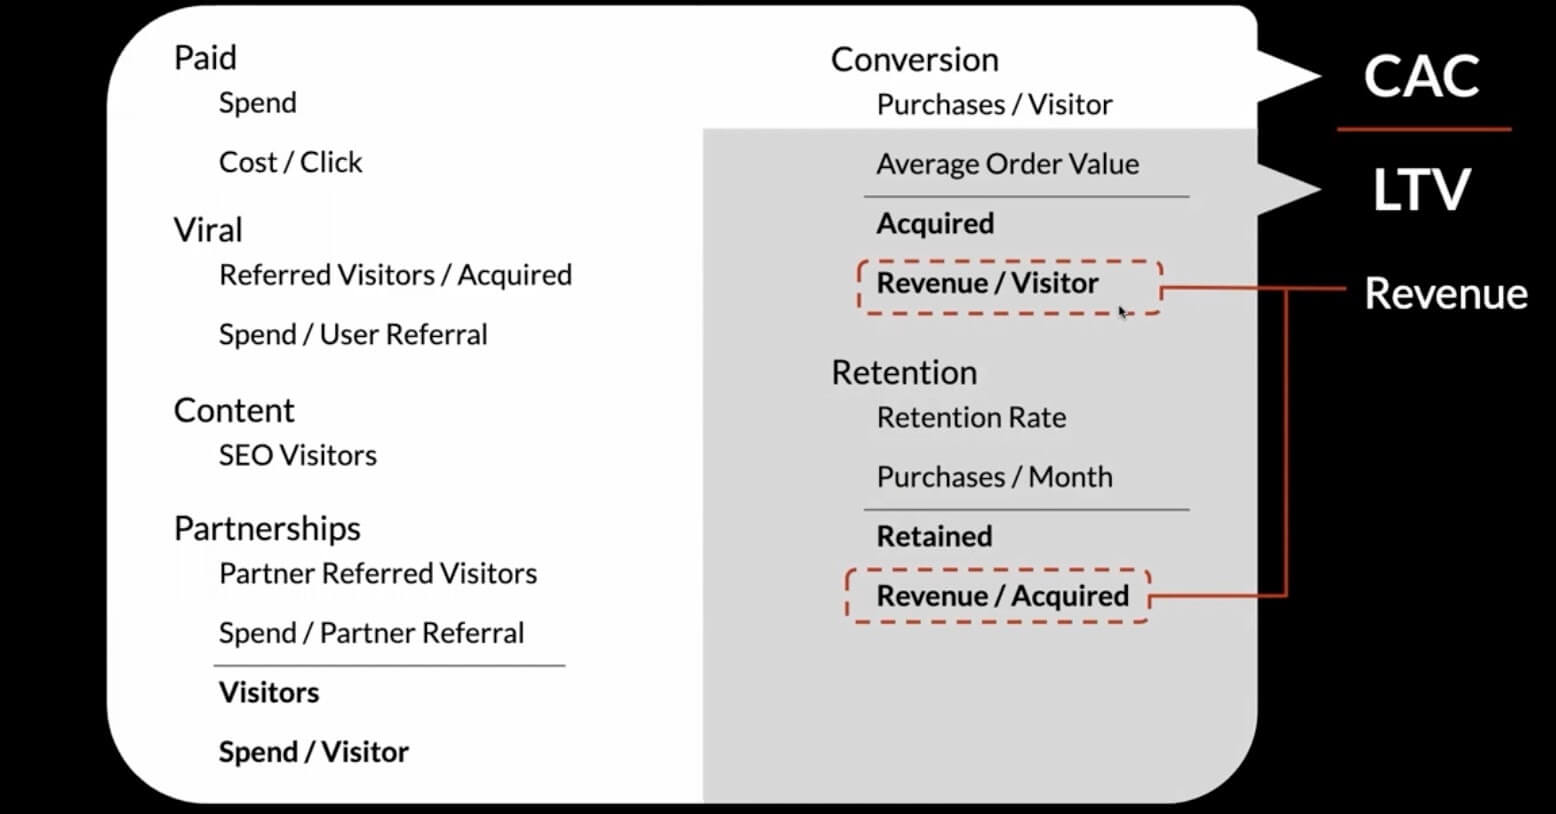
Revenue
You also have revenue and those are the two core metrics.
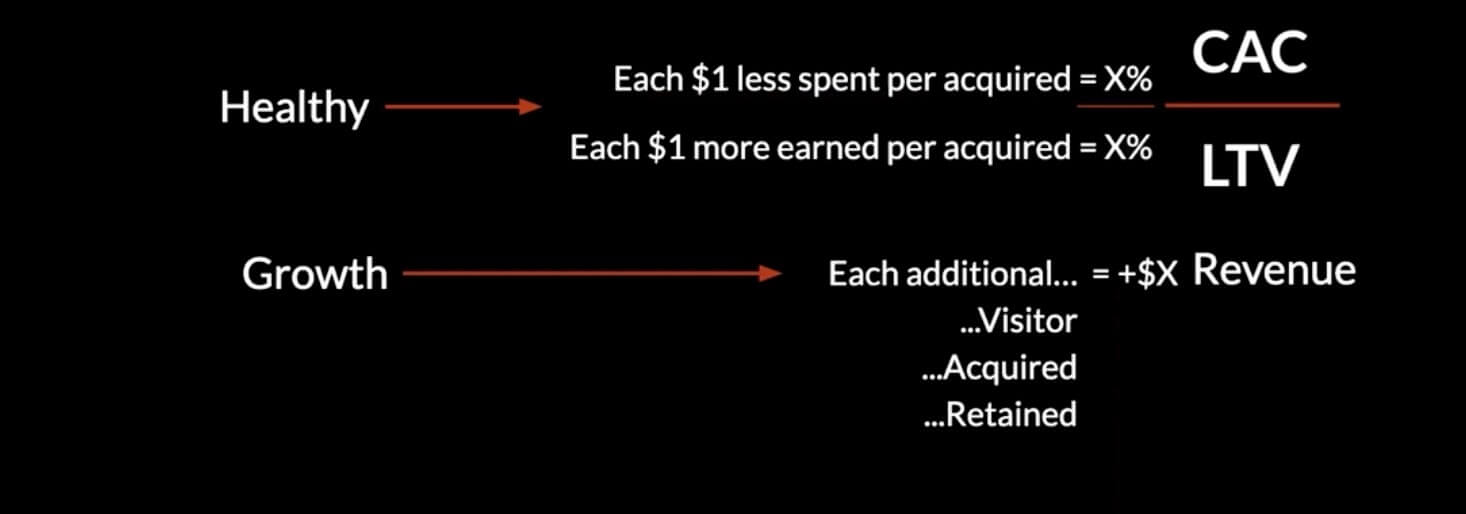
Health metrics & conversion metrics
I talked some about the concept of volume and conversion metrics, on the company level, I think about it as a health metric, and then a volume metric.
- CAC over LTV being the health metric, and
- Revenue is the volume or overall growth metric.
You want to understand for every change you think you can get in one metric, how is that going to translate to this ending growth metric you're trying to achieve?
Same thing with revenue. That's what I call healthy growth. The reason why it's important to distinguish between these two types of growth metrics is they can often be at odds with each other or you can use them as trade-offs.
The most common example is in paid marketing, where you can choose to spend more, and you'll get more revenue, but it will come at the expense of efficiency and your overall cost to acquire.
Ideally, you get both of them at the same time. That's definitely doable and feasible 100%. You as a company have to understand and be prioritizing which one's more important to you, to what extent, do you want both?
Because a lot of times people end up in situations where they're expected to achieve both, you see it all the time and it's not always feasible. We have to have this language around health and growth metrics, and which one's more important to us and it can change.
This is what I call applying a "don't do" framework.
Applying the “don’t do” framework
The reason why I want to really emphasize the "don't do" is because you have to decide, what do you not do?
I'm sure a lot of people reading throughout their careers can relate to the concept of just having too much to do and not enough time, especially if you're in a startup environment. It's really important to be laser-focused on what do we not want to do? How do we cut that out? But the question is, what do we not do?
That's why I want to introduce the framework to help us understand that.
The growth optimization process
But first, I want to talk a little bit about what a growth process is to set some foundation so we can figure out what we want to score and what lays the foundation there.
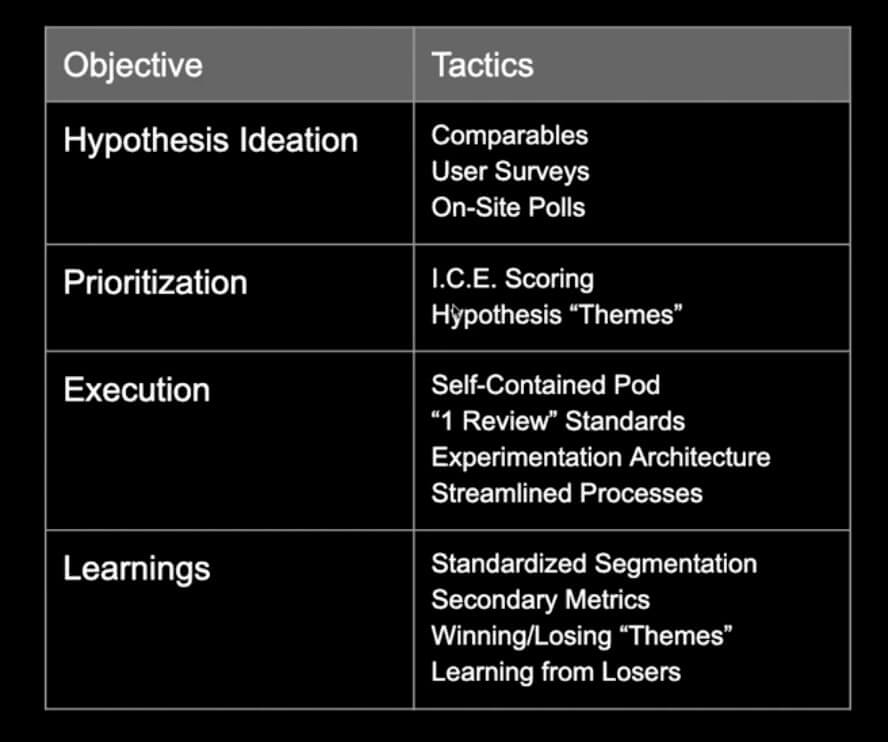
This is how I organize a growth optimization process and I think it's actually really applicable across any function. Starting with ideation, then prioritization of those ideas, you have the execution against ideas that you want to do or the hypotheses and then you have the learnings, which then feed back into ideation.
It's really a cycle or loop. In each one of these different stages, there are different levels of sophistication and different levels of how well a program executes on these. It's really important to do all these well, because like I mentioned, it is a loop and it is a cycle.
What you find is, if any one of these is lacking or it's a breakage in the cycle, it really hurts the whole cycle. So it's important to know how well you're doing on these and how you can be really sophisticated and execute really effectively in these different areas.
I'm really just going to dig into the ideation and prioritization pieces here although I'll share a high-level cheat sheet on the second two.
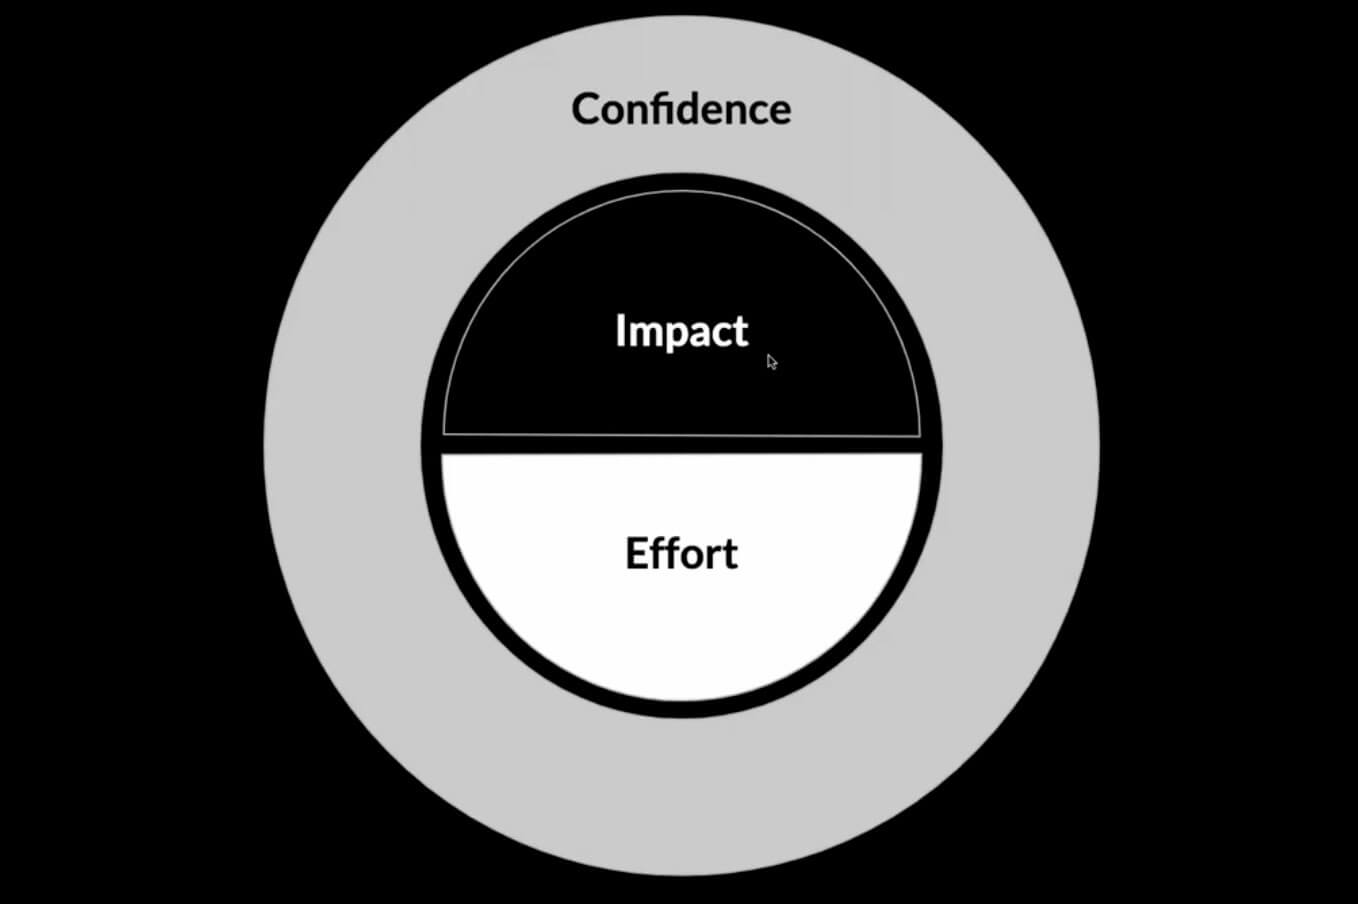
ICE scoring
Some of you may be familiar with this concept of ICE scoring. For those of you that aren't, it stands for impact, confidence, and effort.
It's a really simple way to score your different ideas on a backlog. Let's say you have 40 things in your backlog, it's a simple way for you to mind map out how you're thinking about these things so you can sort that and say, okay, these are the top 10 and use that to dive a little bit deeper.
I also think it's really valuable just for conversations. For example, I'll ICE score it and show people this is how I scored it, this is why, and we talk about that. Maybe I'll ask them to ICE score it as well so we can say, "Oh, you scored this two higher than me - why?", and we actually uncover a lot of interesting insights and expertise.
You might realize things you didn't know were the case and this is why you have more confidence in that. We have a great learning there just by itself.
But ICE scoring can be different for different people. I will say, the point of ICE scoring, as I mentioned, is to create a sort ranked list, at the end of the day.
You want to do it on 40 or more ideas in a lot of cases but it should be a fairly fast process. The problem is, some people don't spend the time to do it because they just think it's gonna take too much time.
But when I do ICE scoring, we're talking 30 minutes to an hour max. You can do it on individual ideas, you can also do it on initiatives and different levels, however, you want to do it.
At the beginning of the quarter, we'll look at 15 things we're gonna do for the quarter and we'll ICE score those. It also helps me to then communicate that to stakeholders, to your manager, to executives.
Impact over effort
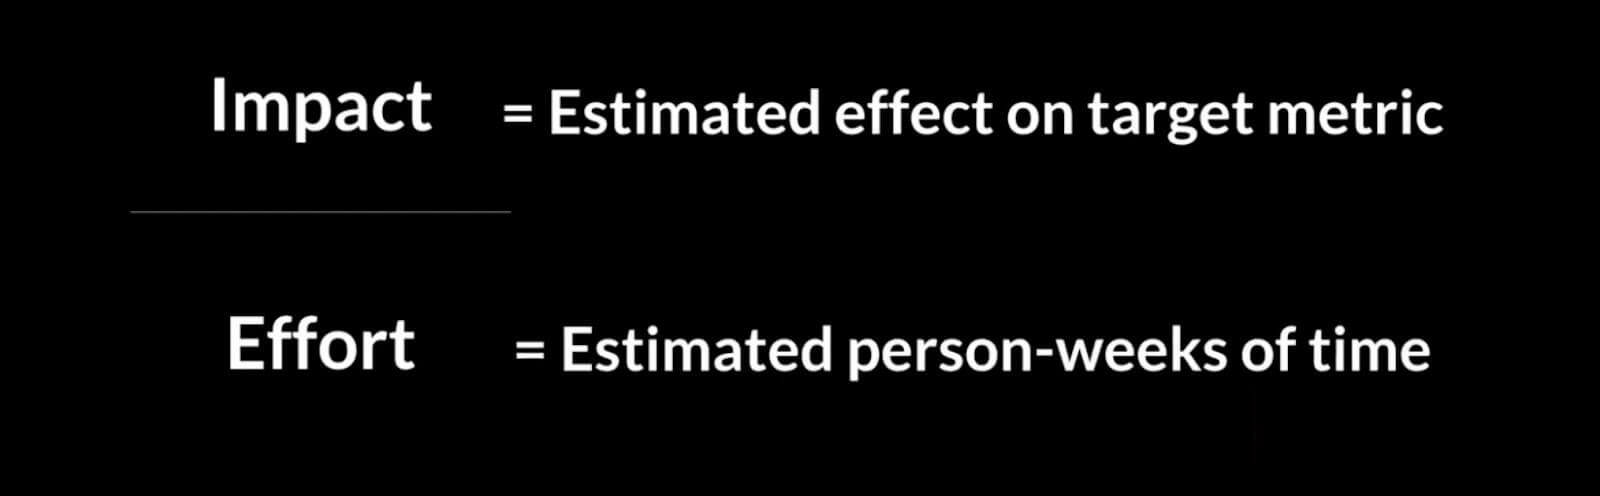
This is structured in a certain way, impact over effort, because truly, you want to optimize for impact per effort spent. So you have the impact to effort ratio, like I mentioned, the impact is the estimated effect on the target metric you're trying to achieve.
That could be one of those metrics from the growth model I talked about before or a target alpha metric.
For me and my team, we focus on website conversions. So our output metric we're trying to affect, our north-star metric, is LTV per visitor, per person that comes to the site.
Then you have also effort, and that's estimated person-weeks of time.
The way that we score these is we do impact on a one through five scale. The one through five scale for impact is roughly 5% increase each so one would be a 5% estimated impact on the target metric and a five would be 25%.
Whereas effort can be a little bit more of an open-ended scale, where we'll do you half weeks of time, an engineer's time, or whoever's time it may be. So it could be a one, it could be a 2.5, you could do a one through five, or one through 10 scale, whatever works for you.
The point of the exercise is to score and score quickly and use your initial thought to spur that discussion and that sort ranking.
It’s all relative
The other thing I'd point out is that it is a relative skill. You don't have to be sure that something is a 25% on impact. But what you want to do is go through and score all your ideas in the impact column at the same time, and you want to say this one's a five and so, therefore, I think this one's a four and relative to that this one's probably a two.
Because again, the objective is to rank these ideas from highest impact, highest ICE score to lowest, and not to be actually accurate with what the scoring means.
Confidence
Confidence is actually the most important scoring people don't do. I think it's because it takes a little bit of thinking and you have to challenge your own opinions.
Data source
For me, confidence in a lot of ways is derived from this source of the idea. If you think about things you're confident in, let's just say a scientific paper, newspapers that you follow, or whatever. All of that has to do with the source:
- How well do you trust the source?
- How well has the fact been corroborated and looked into?
When you're talking about the confidence of a hypothesis, for me, it largely comes down to the source of that idea. There can be other factors here, too. But here are some of the main idea sources that we focus on in our process.
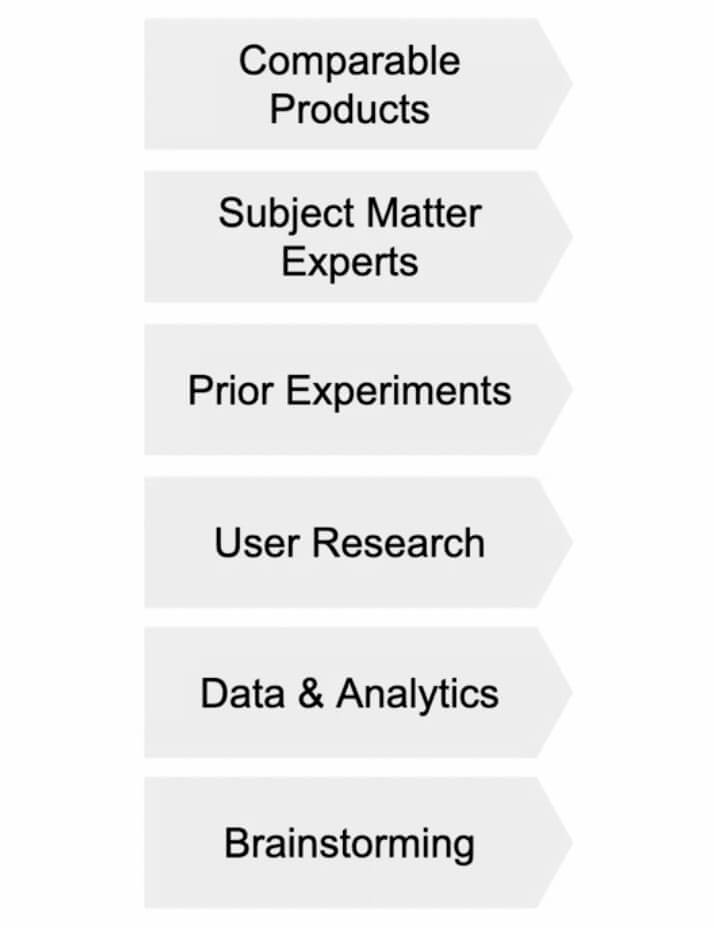
Most of you guys are probably most familiar with the one at the bottom, which is brainstorming. But it's actually really important to have a really diverse backlog, when we look at our backlog, there should be at least three or four of these sources in there.
Because that's going to de-risk it, I actually think that brainstorming is the least confident source. Because you think about it, you're in a room with your peers and whoever else it is, and you're just coming up with ideas. It's really not that proven, except from your own opinions and your own expertise that you're drawing from.
I really like comparable products, especially if it is a product that's an established company versus an emerging company because you know they've tested and anything that's on their site or in their product's been tested and proven out.
But we also learn a lot from prior experiments and doing data analytics. User research is also another really big one for us. Especially when we're starting a larger roadmap we'll do a lot of user interviews.
I'm sure those of you reading probably do all of these to some extent but when you put it as more of a requirement, our backlog should have three to five of these ideas sources always in there, it changes it into something a little bit different. As I mentioned, we're really talking about confidence here, the confidence of ideas.
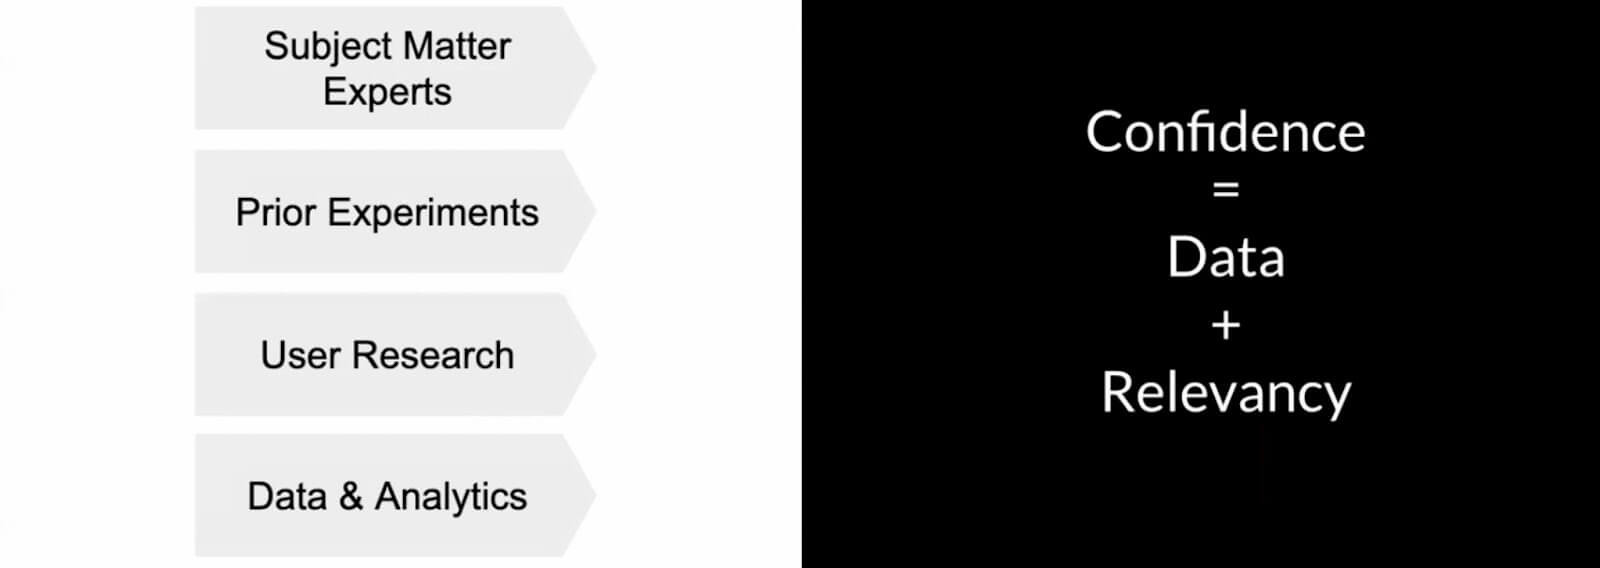
Confidence = data + relevancy
We think about confidence as data combined with relevancy. What that means is, we want something proven so we go to, as I mentioned an established company's product, that's been proven out, but how relevant is that product to our product?
Something can be proven but not be relevant. We want to take both into account.
A few of the ones that are important for us are comparables, we do a lot of teardowns. I do a lot of stuff with subject matter experts and doing user interviews. We'll give them a free Masterclass subscription just to talk with us.
Then we do a lot of on-site polling as well, one of my favorites is, when we get these more qualitative hypotheses, we'll then take those and play them back to people and say, "Hey, which of these were most important for your decision of whether to buy masterclass?"
That will then give us a bar chart we can look at and say, "Okay, this is actually the most important hypothesis for us to work on right now".
Impact
Let's talk a little bit about the impact portion of the ICE scoring. If you're trying to achieve this certain metric (for us, it's LTV per visitor, it's a conversion metric) impact and how you understand what's going to be most effective for people in your product really depends on what is the decision?
What's the decision going through people's minds when they translate into this metric, when they go to buy, when they go to pick back up the product or to reuse it or whether they're going to renew. What is that decision going through their mind?
Because that's going to determine the ideas you come up with and how you can affect it. It's really important to understand that dynamic.
How conversion works
For conversion here's an example.
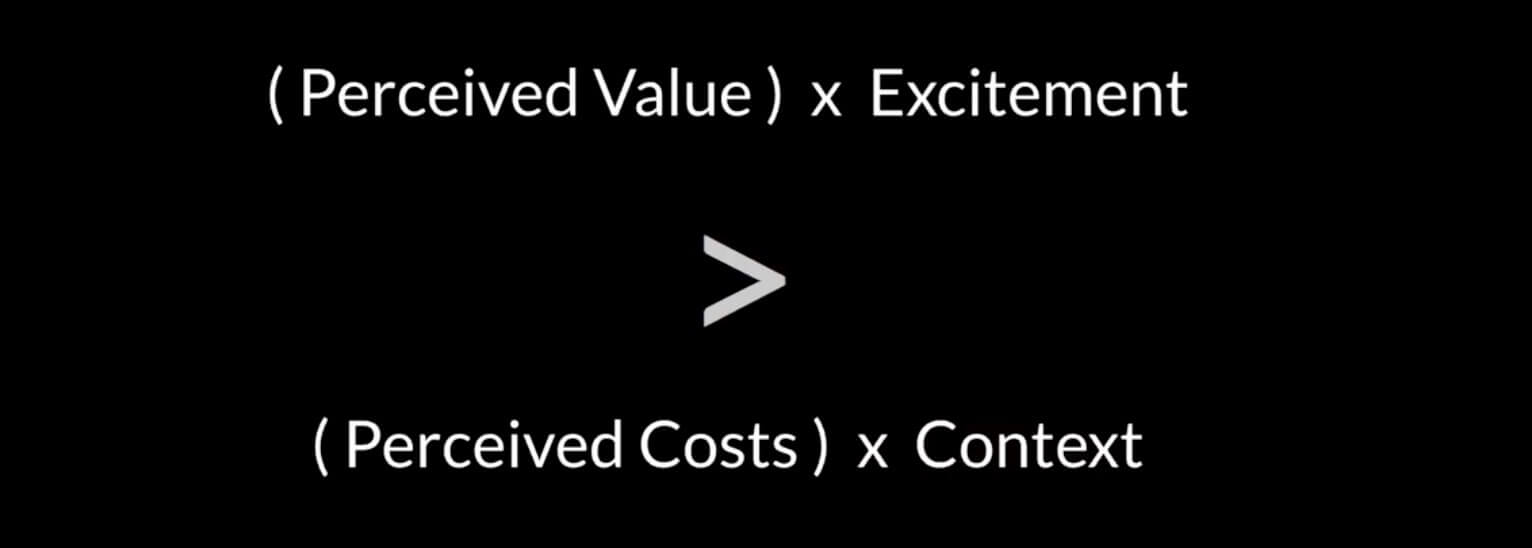
I think about conversion as perceived value and then you have a modifier. You can have the perceived value on the page but when you modify it with excitement it's actually much more powerful.
And then your perceived costs times the context. Cost can be money, time, opportunity cost, a lot of things. But when you put it in context, it can actually pretty much diminish that.
So we want to be increasing the perceived value, excitement, and then relative to the perceived cost in the context.
I'll walk you through how we implement some of this dynamic and how we then bring that into our hypotheses at Masterclass.
Questions we ask
When we're asking people questions, or we're doing user research, these are the type of questions we're asking.
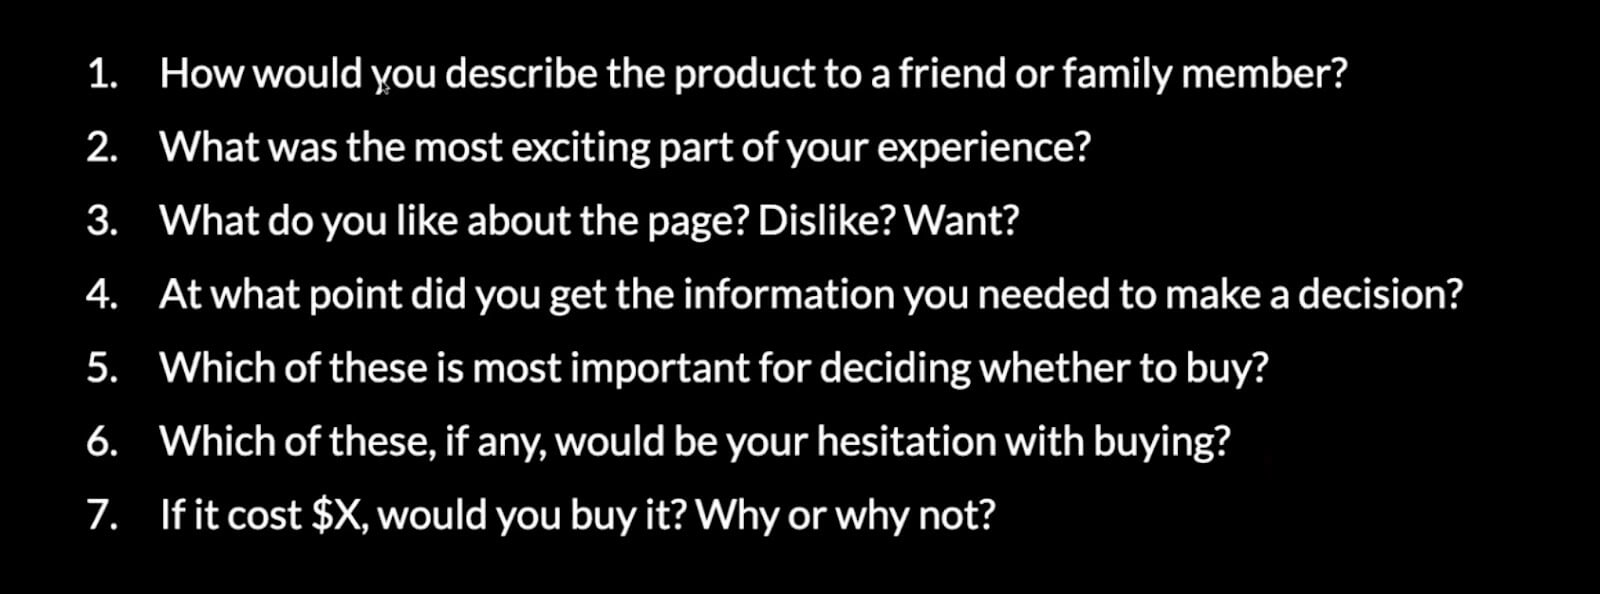
What you'll notice is, it ties back to that equation I showed earlier. We're trying to understand:
- Where's the perceived value?
- What gets them excited?
- How are they perceiving the costs? And
- What would put it into context for them?
When we're doing comparables research, we also think about it in the same structure and any other idea source. This gives us a little bit of sense of unity towards the direction of this metric we're trying to achieve.
Whereas if we just went off and did a lot of ideation, we might not have that.
Let's take a look at how we've implemented this dynamic on the Masterclass site that's up there right now.
We want to maximize the perceived value
Diving in, you can see here are some ways we try to maximize perceived value.
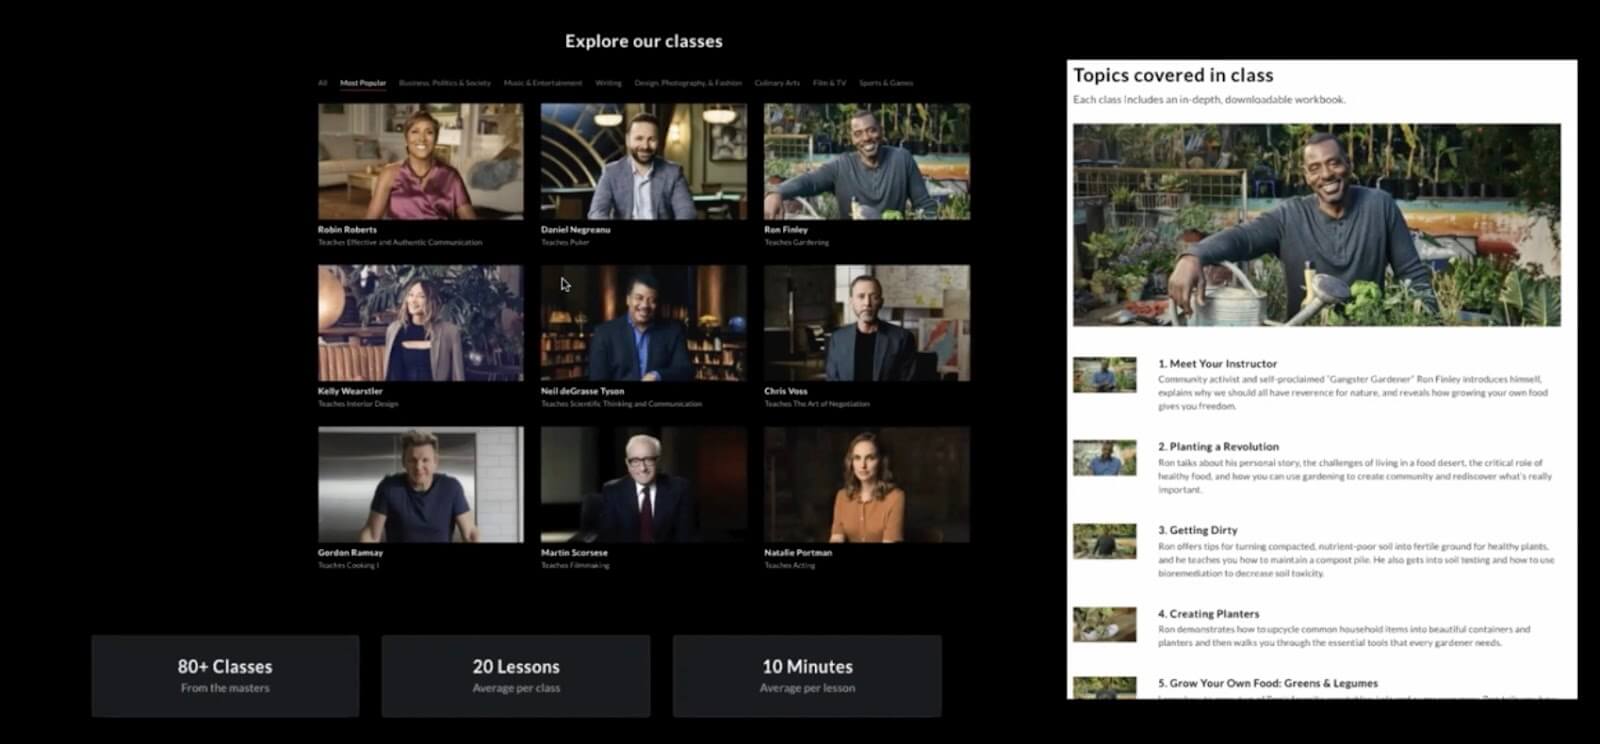
You go on to the webpage, you can look at the homepage and the class pages, we have the main page and a page for each class we offer as well.
What you can see is when we're showing the catalog and we're talking about what's included in the subscription when we're talking about topics covered in the class, there's a lot there - you can see a lot so you're feeling like you're perceiving in terms of value that you're getting a lot.
We have copy on the lessons, we have 80 classes, 20 lessons per class. You feel like with a purchase you're going to be getting a lot. That's the perceived value portion.
And get them excited
Then we want to get them excited and this can be different for every product and this comes through user research. We find for Masterclass if you've ever seen our videos, they're very exciting.
We also find that people are really excited as to these people that they know, these celebrities, and they have this feeling of dopamine from this recognition.
We started integrating into this site, we want to get them excited, we want them to feel the value and also get them excited about the product. So when they're ready to make a purchase, it's a no-brainer.
What about the perceived costs?
While reducing the perceived costs
What you'll notice is the one there in the bottom with the 10 minutes average per lesson, that's a time cost that we're trying to diminish.
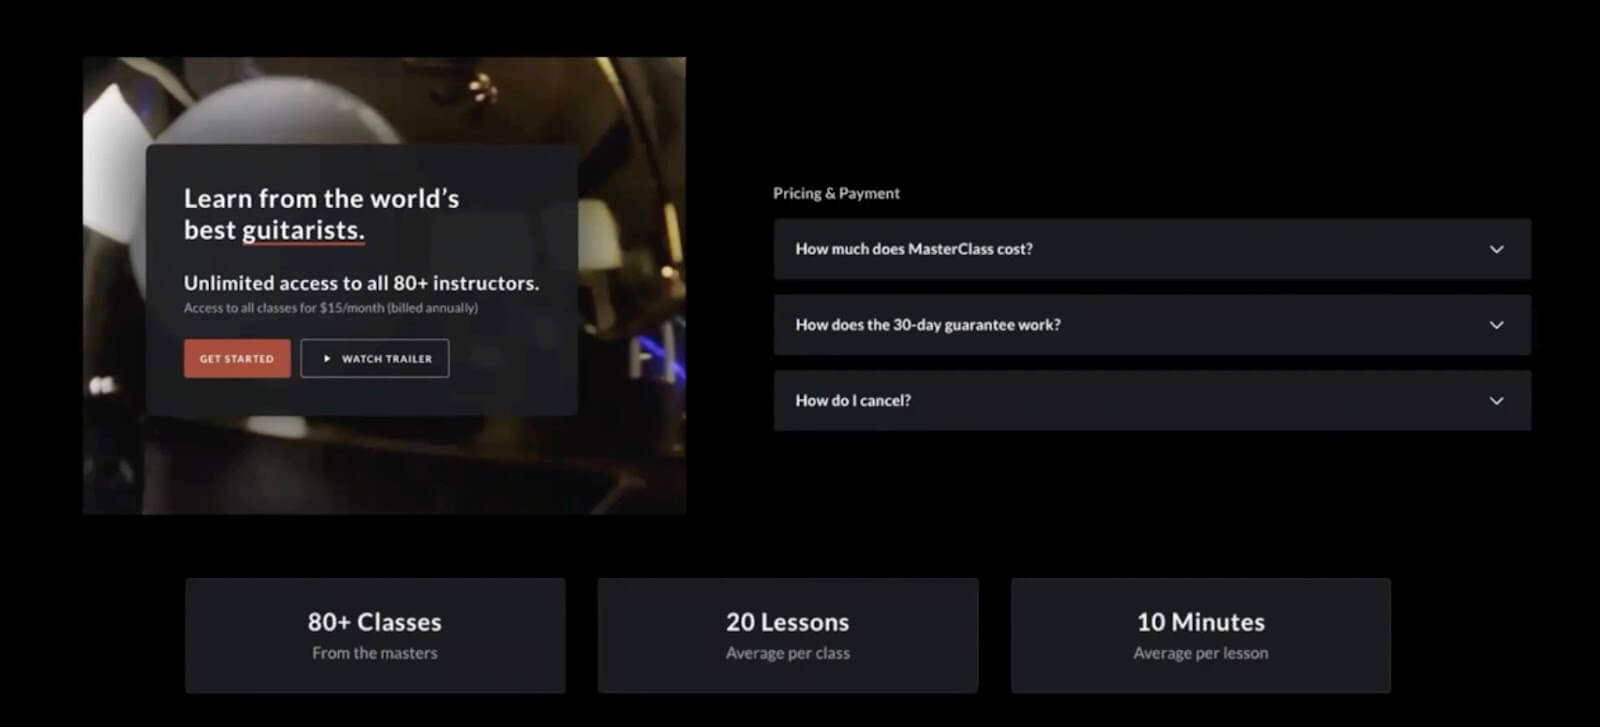
People don't have a lot of time to go on social media so how do we reduce the perceived cost there? Even just bringing forward this information they might not have known about is a way to reduce the perceived cost because they just didn't know about it and so they'll assume that it's actually really high, by default.
You can also see in the way we're presenting the price and creating some FAQs around the cost itself. Again, bringing for that information that's going to help them get rid of these assumptions, and give them the clarity that it's actually not as high of a cost as they thought it was going to be.
What about the context of making it?
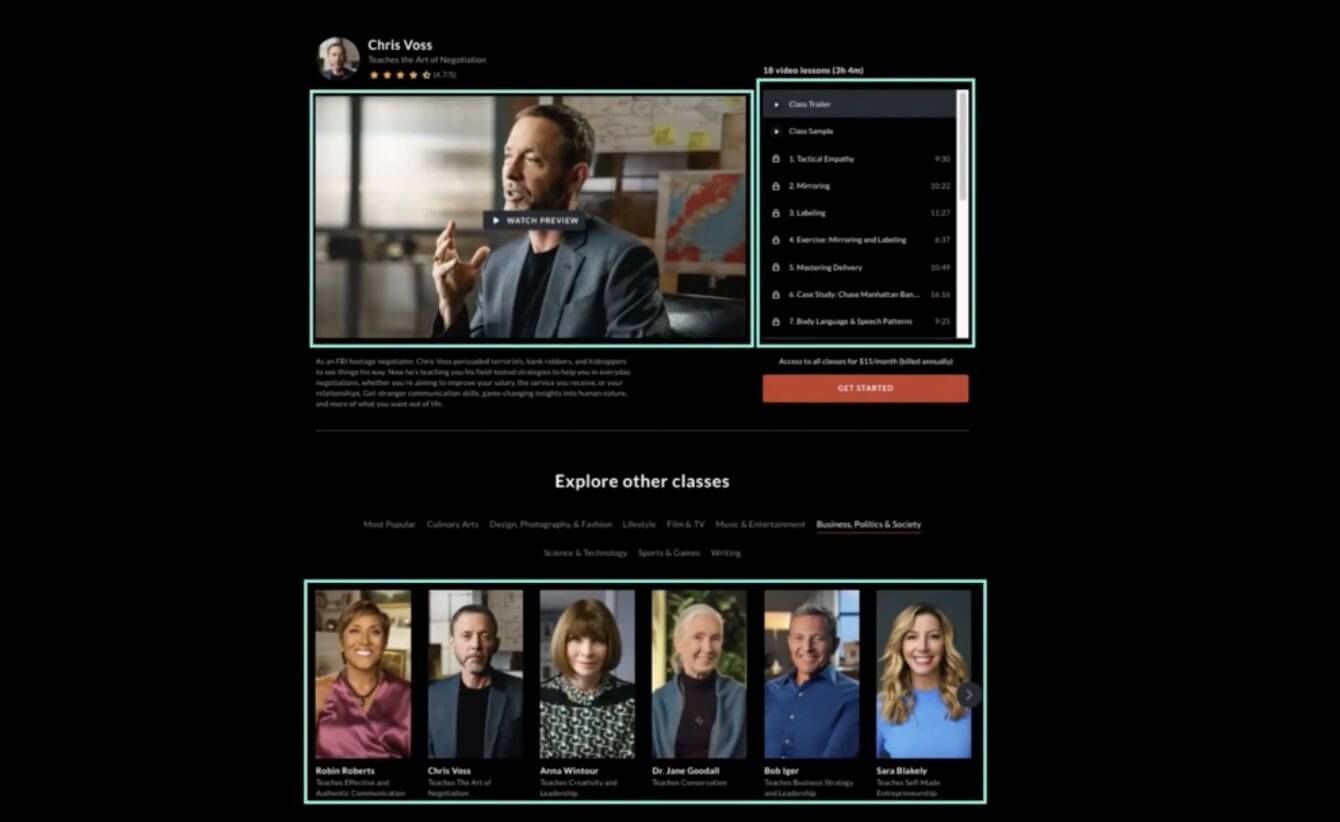
And helping them understand it’s feasible right now
This really comes down to making it feasible for them at that moment. The context is “I understand that the cost is this much, but for me, can I do it right now? Can I make a purchase right now?"
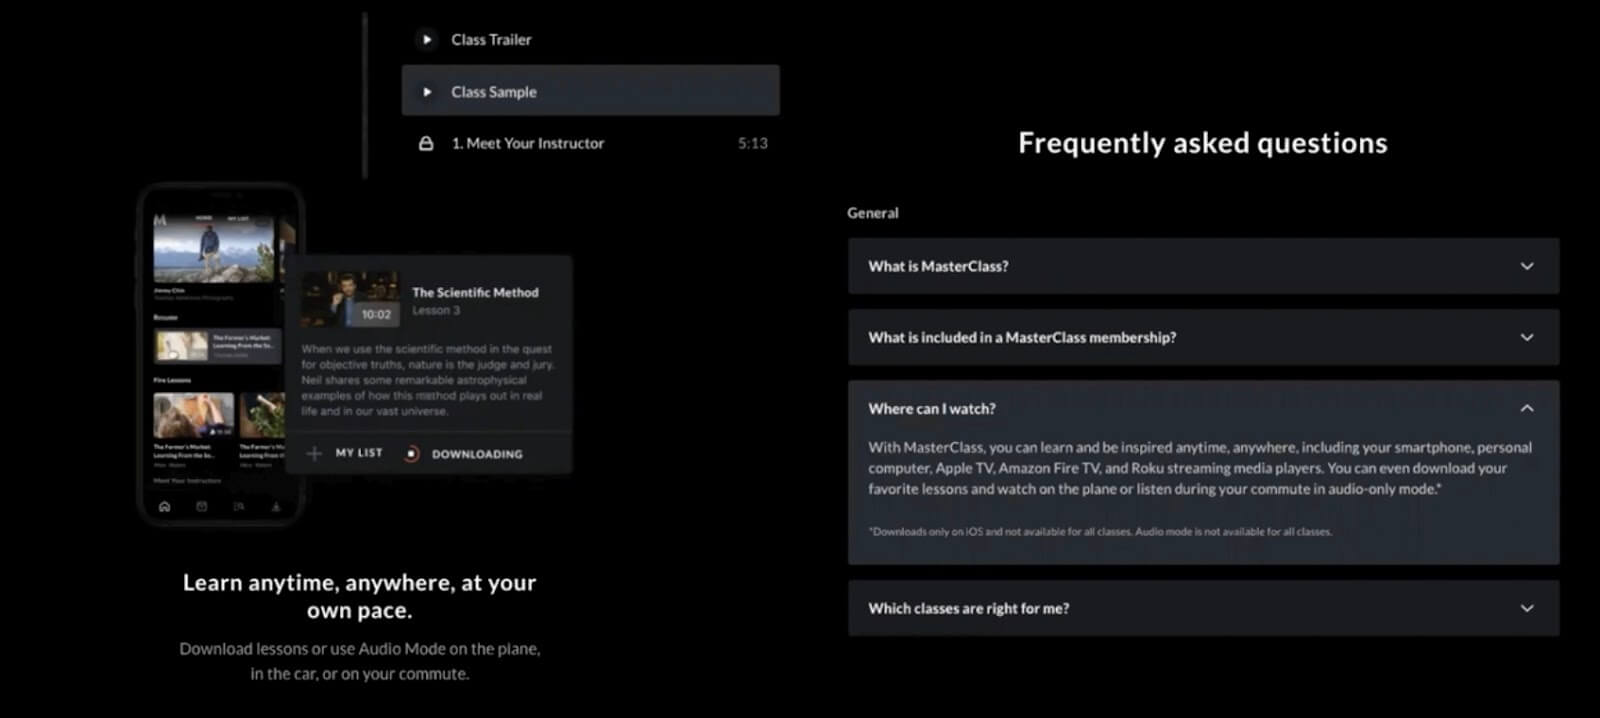
What you can see is that throughout the product and website, we bring forward some of these more execution-focused questions that come to mind, like:
- What is the class sample going to be like?
- Where can I watch it?
- Am I going to be able to do it at any time at my own pace?
These are all questions they have, that help them understand in the context, that these costs actually aren't so bad, I can actually have a lot more flexibility than I thought.
That's just a quick run-through of an example of Masterclass and how we implement the ideation and prioritization with ICE scoring and how you can see that come to fruition on the site along with a deep understanding of the decision that users are going through when they're making a conversion decision, in our case, that's going to ultimately affect that metric we're trying to achieve.
Process cheat sheet
As I mentioned, I'm not going to go through the execution and learn portions of that but I will share this cheat sheet of some different terms that come to my mind when we're talking about those different phases and stages, and what's important to be really good at in those stages.
ICE-scored backlog
At the end of the day, you end up with an ICE-scored backlog, you have impact over effort, you multiply that by confidence.
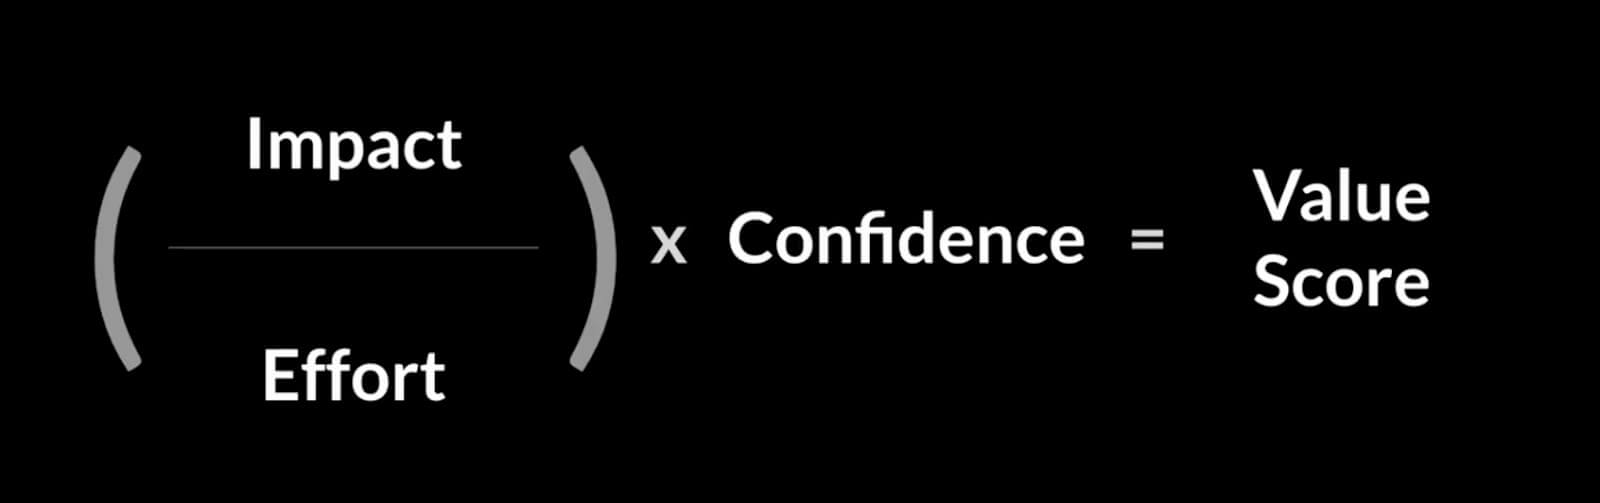
The scoring can be different things to different people, as I mentioned, we do one through five on impact, point five scale on effort and that scales up by person effort weeks. In confidence, we do 50%, 75%, 90%.
The “don’t do” framework
Tying that all back to this concept of a "don't do" framework we want to take that backlog, especially if it's at the initiative level, like a quarter planning level, and say, "Okay, the top 25% are things that we want to double down on, that we know what we want to do, we can't miss it".
The bottom half of things on the list should be things you know there's no way we're going to be getting to this.
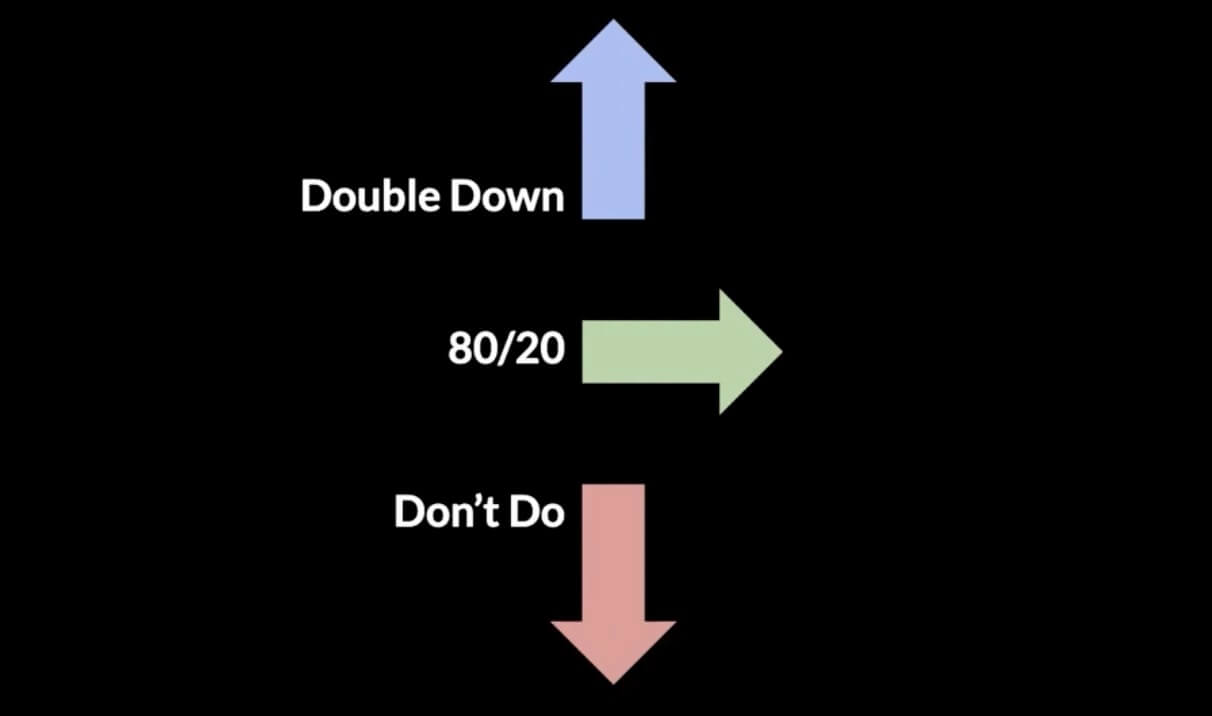
In any list, if it's more than five things, there should be half of them you're not going to do in a course time.
Lastly, you have the second quarter, the top quarter. These are kind of the quick wins or continue to evaluate type of things where you say, "Hey, we may or may not do this, things need to evolve. But we want to keep an eye on this and continue to evaluate and identify there are some opportunities here that we can seize on".
I want to make sure you understand this process I just went through and this ideation and the scoring process should be no more than a week. It doesn't have to be a whole thing.
In a week's time, we have a really strong backlog. But it's 100% worthwhile.
Optimizing team throughput
How do we talk about execution on the team? And how do we maximize our team's overall output and throughput?
Throughput funnel
I think about a throughput funnel, for any product manager/growth product manager out there, these are the three core metrics that I think about in our team.
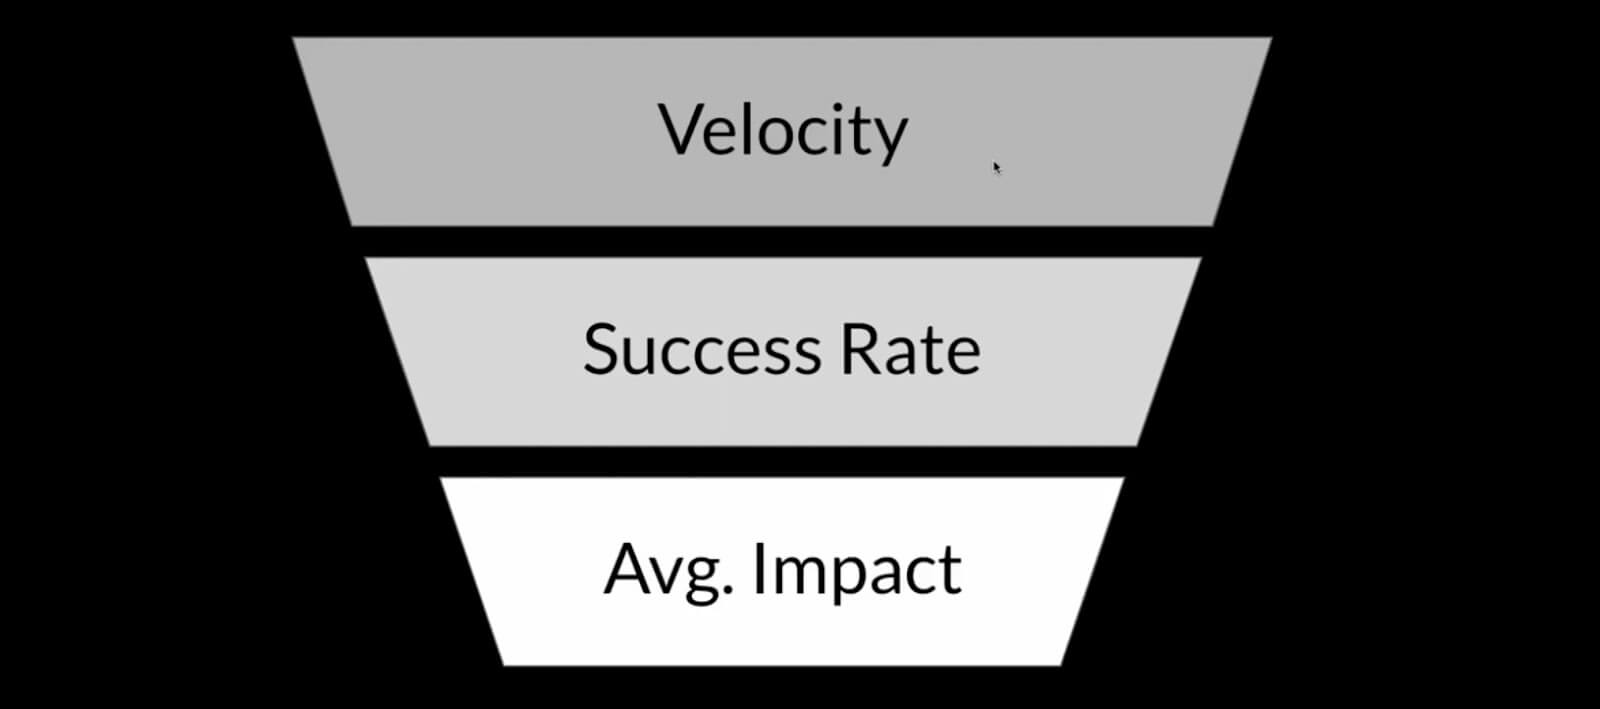
We have velocity, success rate, and average impact.
Velocity
We have our test velocity, how many tests, perks, or experiments are we running per engineer that's on the team per week? A best practice for that would be Airbnb, they do one test per engineer per week on their conversion team.
Success rate
What is that success rate? An average good success rate is about 20 to 30%. You should expect about 70% of your tests to be flat or negative, which, by the way, is actually not a bad thing.
You learn a lot from negative tests, what you don't want are flat tests, which tell you you're not being ambitious enough with a test to even get a signal. You don't really learn a lot from there.
Sometimes you do, sometimes that is a learning in and of itself that you learn it doesn't move the needle. That's totally fine as well. We actually celebrate all learnings whether they're flat, down, or positive, and share that out.
Average impact
Lastly, you have average impact. This can vary depending on the maturity of the company. So for Facebook, a 1%, might be a really big win. If it's earlier stage, maybe you're getting big 20% wins.
But in general, unless you're a really mature company, a 5% is a good bottom threshold to say, "Hey, we're trying to shoot for at least 5% average impact per waiting test".
These metrics can change over time and there are different ways to optimize for them.
This is just demonstrative so just keep that in mind.
Throughput metric curves
Testing velocity
This is the top of the funnel in your program health metrics.
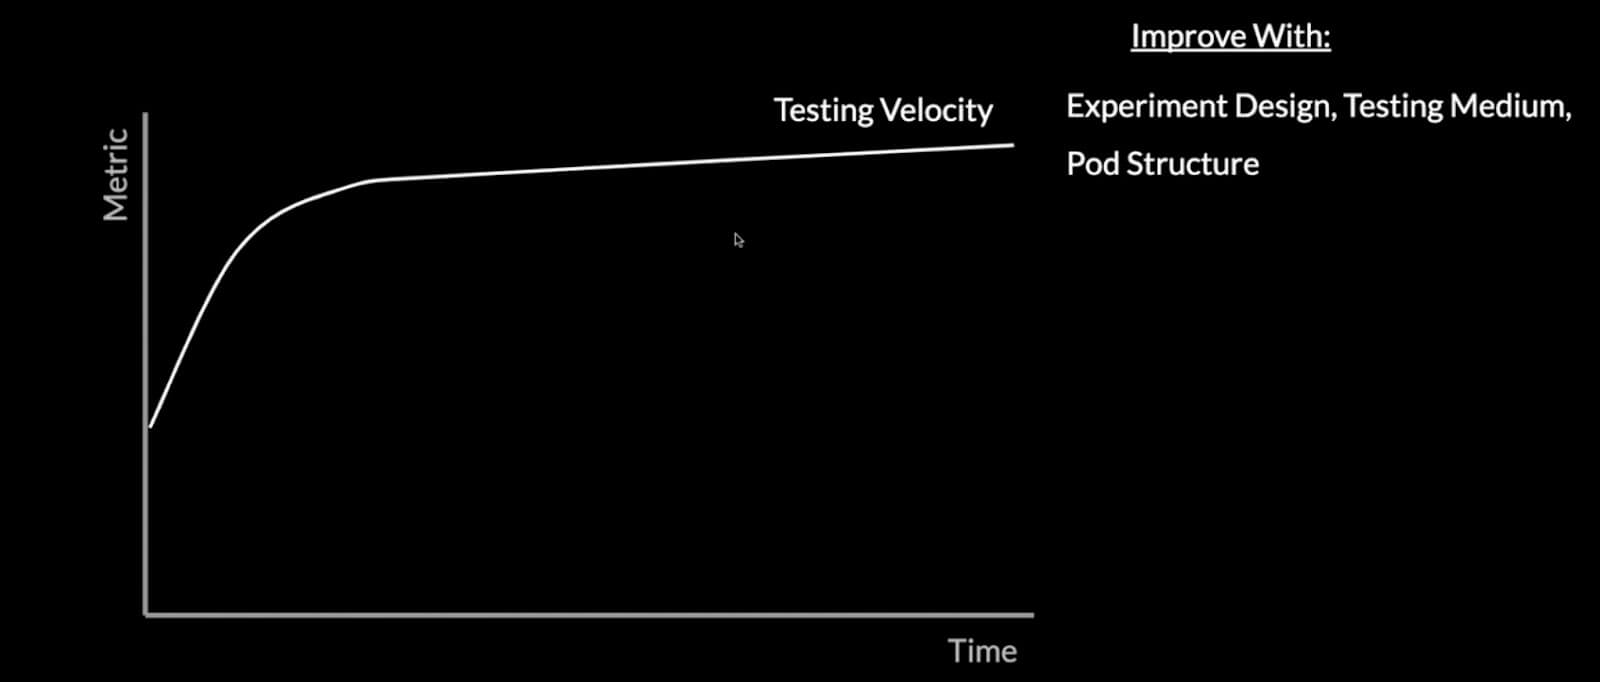
The reason why this is more of a steep curve where it goes up in this sharp turnover is there can be some really quick wins that can significantly increase your testing velocity.
I've listed some of them there on the right, we have experiment design, testing medium, and pod structure.
Experiment design
What I mean by those is how are we setting up the experiment in a way that it can be executed quickly? And even making the design quick. One feedback session with design, one feedback session engineering, versus multiple iteration cycles.
Testing medium
Do we need to A/B tests in-house? Or can we do it in Optimizer? Can we get the same measure at the poll? That's the testing medium.
Pod structure
Do you have all the resources on the team? Do you have dedicated analytics resources, dedicated design resources, and that kind of thing?
Those are all things that if you change those, can be really quick changes and can double your testing velocity.
What about the test win rate?
Test win-rate
Backlog size & quality
This has largely to do with the backlog size and quality as well as winning themes. Going back to that ICE scoring and your idea sources, that's really where this comes from.
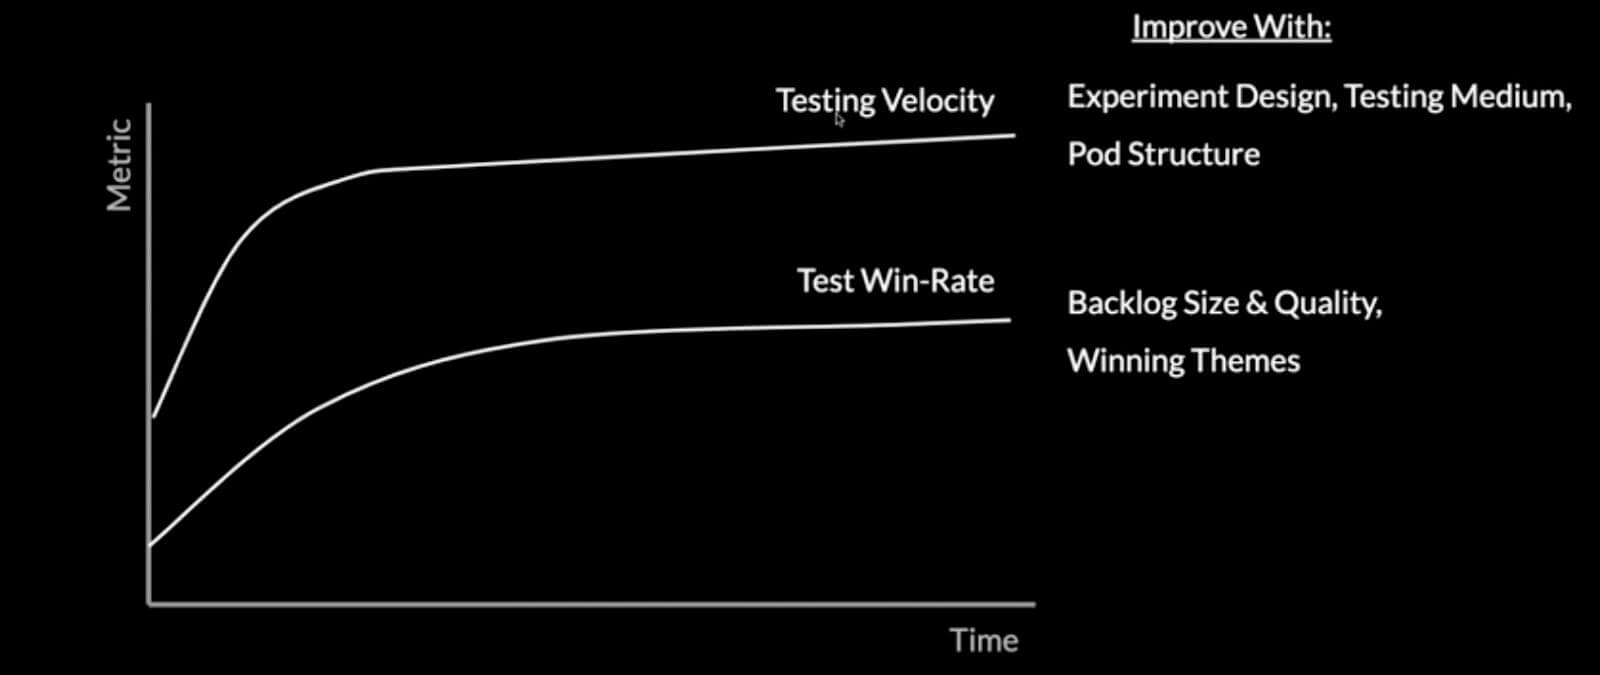
Do you have enough hypotheses in the backlog to de-risk it? And are they the highest quality in that do they have high quality, high confidence idea sources behind them?
That's really what goes in, what comes out as far as ideas and that translates directly to the win rate. I also have the idea of winning themes and losing themes.
Winning themes
When you do a couple of experiments towards a certain goal, certain user, or problem you're trying to solve, how do you then make sure you're bringing that all together and saying, "Okay, this is a winning theme, we want to double down on this so there's more gold to be had here".
Compared to the losing themes, where you also want to say "Okay, these couple of things lost, and so we want to make sure we don't do any more tests on this side". That's what's going to maximize and optimize your win rate.
Avg. lift/win
You also have average lift per win. This one's actually pretty interesting, because it can, as you can see change significantly over time.
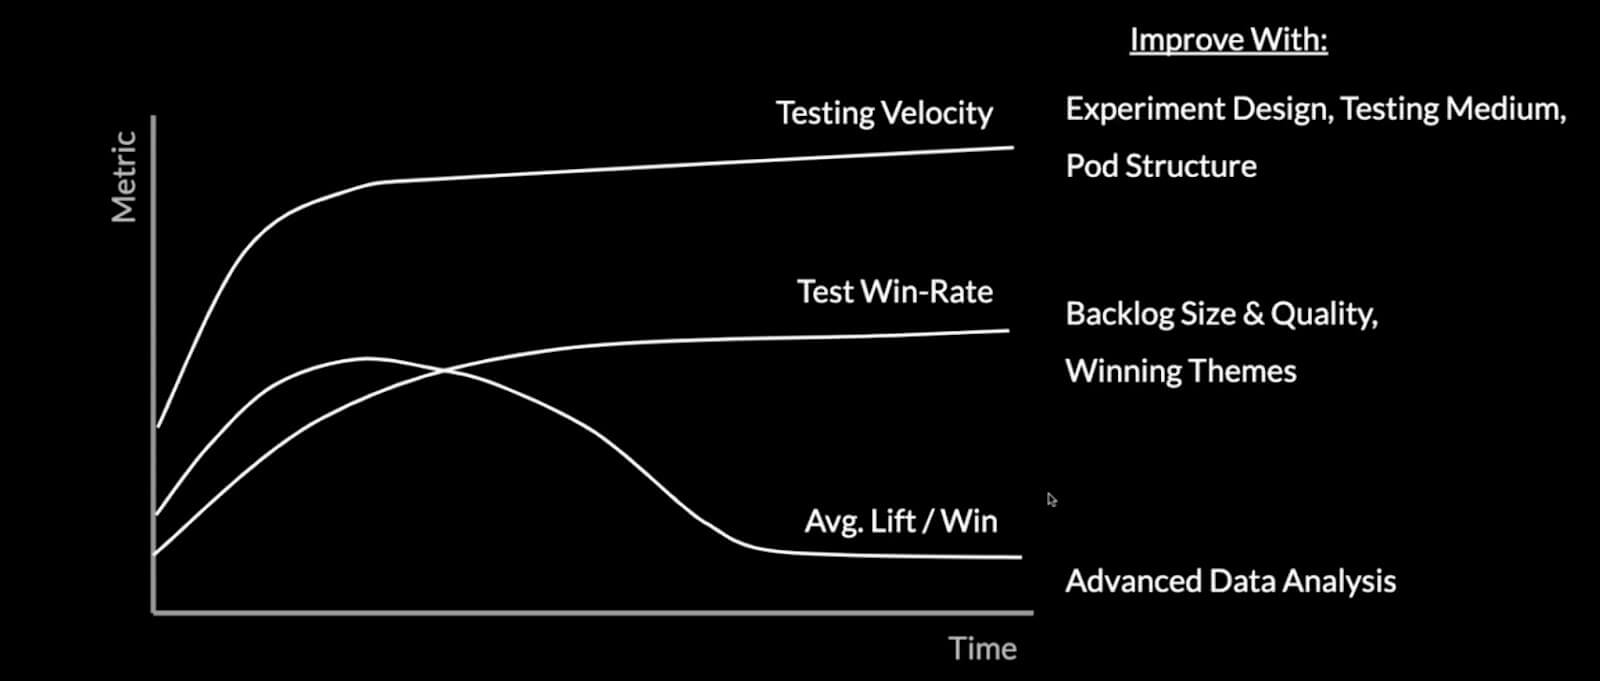
The reason being is it has to do with the optimization towards a certain goal over time.
So as you start on a certain optimization goal or certain page, let's just say, or experience, you learn that experience, you start to optimize, you get some quick wins, then it starts to level off as they're less and less, it continues to go down until it's more minor optimizations and tweaks.
That just has to do with maturity.
Advanced data analysis
I will say one of the main ways you can increase your average lift per win is by doing more advanced data analysis and having the data science team onboard. Because what they can do is understand and identify these outsized pockets of things you can push on and they'll have an outsized effect on your target metrics.
They might see that doing this one thing upstream, this one action upstream, a famous example being Twitter and friending five people had huge impacts for their downstream engagement. They might not have known that if you didn't make this correlation between the certain action and the resulting action downstream.
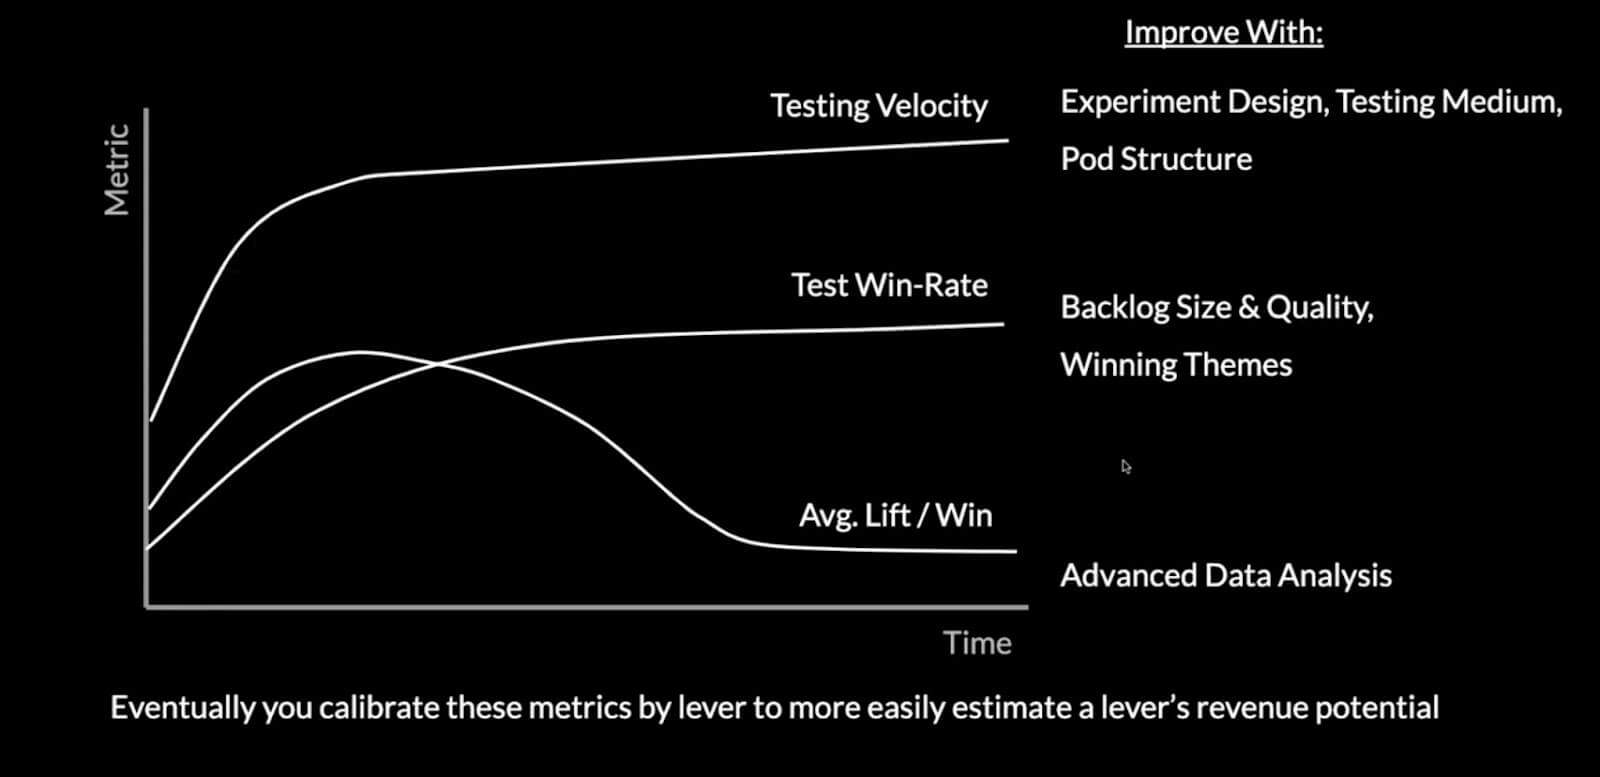
Calibrate
Eventually, you can calibrate these metrics. For us, we look at these every quarter, even throughout the quarter, and say:
- What is our velocity?
- What's our win rate?
- What's our average lift per win? And
- How can we improve that?
So we look at it and see our velocity increased by 40% this quarter, that's great, that's because we did this and we can do more of this, or we're gonna work on the win rate this next quarter.
A hypothesis-driven growth strategy to maximize revenue
What you end up with at the end of this is you have some scored and sorted backlogs by growth lever and you want to maximize those for ROI per-time invested and that's what we do with that is scoring.
They'll roll up to the growth lever as I mentioned, and here we want to more on the executive level optimize for which of these growth levers should we be invested into.
This, if you have a growth model, all ladders back to the end goal of driving revenue and driving growth.

You have to have that growth model and that way of thinking about the growth levers to have that.
But by just looking at this web, you can pretty clearly see that it's a really data-driven, hypothesis-based way that has the most confidence, and really allows you to focus in and be laser focused on achieving things that are going to increase the growth of your company.
Thank you.
Focusing on the wrong metrics can slow or even halt the growth of your product. If you want to deliver the most value, you'll need to illustrate where your strengths and shortcomings lie.
Get PLG Metrics Certified. 👇


Product-led alliance insider
Thank you for subscribing
Level up your product-led alliance career & network with product-led alliance experts.
An email has been successfully sent to confirm your subscription.
 Follow us on LinkedIn